LncCoExpression Analysis
Introduction
TIP
The LncCoExpression module focuses on single-cell RNA sequencing (scRNA-seq) data, aiming to characterize co-expression relationships between long non-coding RNAs (lncRNAs) and protein-coding genes, construct cell population-specific co-expression networks and functional modules, and perform functional enrichment analysis for modules to identify key lncRNAs and their potential pathways of action.
Long non-coding RNAs (lncRNAs) are non-coding transcripts longer than 200 nt that play extensive roles in chromatin state maintenance, transcriptional regulation, cell differentiation, and disease progression. Based on single-cell resolution lncRNA expression profiles, we can construct co-expression networks together with protein-coding genes; then extract functional modules through graph community detection and provide biological interpretation by integrating pathways such as GO/KEGG.
Theoretical Foundation of LncCoExpression
Core Principles
- Differential Gene Acquisition: Using Seurat's FindAllMarkers/FindMarkers at the cell cluster or group comparison level to identify differentially expressed lncRNAs and protein-coding genes (default thresholds: |avg_log2FC| ≥ 0.25, p_val_adj < 0.05).
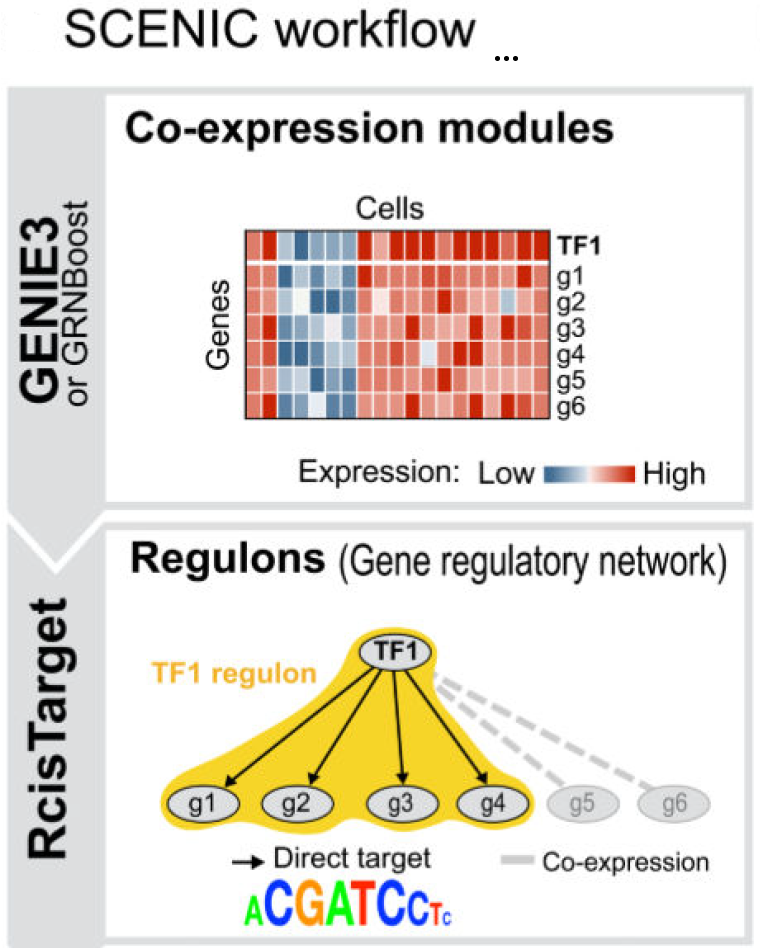
- Co-expression Network Inference: For the retained set of differential genes, gene-gene co-expression relationships are learned using Grnboost2 from the pySCENIC workflow, resulting in importance scores (weights) for each edge.
- Network Filtering and Construction: Retain the top 0.5% of edges ranked by importance score, construct the network using networkx, and require each protein-coding gene to be connected to at least one lncRNA to ensure the network centers around lncRNAs.
- Module Detection and Annotation: Apply the Louvain algorithm for community detection on the network, filter out small modules with degree < 7, and subject the remaining modules to functional enrichment analysis (clusterProfiler, GO/KEGG).
TIP
The above workflow is independently executed for "each cell cluster" and "each group comparison", resulting in cluster-specific and condition-specific lncRNA co-expression networks and functional modules.
Principle Illustration
SeekSoul™ Online Operation Guide
On the SeekSoul™ Online, LncCoExpression analysis is designed with visual parameter configuration and one-click computation.
Pre-Analysis Preparation
TIP
- Data Preprocessing Ready: It is recommended that upstream standard quality control, dimensionality reduction, clustering, and cell type annotation (such as
CellAnnotation) have been completed. - Metadata Naming Conventions: It is recommended that metadata column names and content use English/numbers/underscores, avoiding Chinese and special characters.
- Novel-lnc Detection: If novel lncRNAs need to be identified from alignment results, enable "Identify novel-lnc" in the platform parameters and provide
bam_pathin the sample information table. This process is sensitive to BAM quality and reference annotation completeness, and is computationally intensive; it is recommended to enable it only when the research needs are clear.
Parameter Details
The table below lists the main parameters and descriptions for the LncCoExpression module on the SeekSoul™ Online (consistent with historical document style).
| Interface Parameter | Description |
|---|---|
| Task Name | The name for this analysis task, must start with a letter, can include letters, numbers, underscores, and Chinese characters. |
| Species | Select the species corresponding to your data: human/mouse. |
| Identify novel-lnc | Whether to detect novel lncRNAs from alignment results. Default: FALSE. When TRUE, bam_path is required (see "Sample Information"), and this step is time-consuming. |
| Sample Information | Configure samples for analysis and their BAM file paths. |
a. Sample | Select the sample for analysis, corresponding to the Sample or raw_Sample column in metadata. |
b. bam_path | Path to the sample's BAM data, required when "Identify novel-lnc" is enabled. |
c. Operation | Click "Delete" to remove the row, click "Add" in the top-left to add a new row. |
| Grouping.by | Select the cell type or clustering label for analysis (e.g., CellAnnotation), used with "Cell Type". |
| Cell Type | Multiple selection, select specific cell types/clusters to include in the analysis (e.g., T cell, NK cell, Monocyte, etc.). |
| Group.byn | Define comparison combinations for analysis. |
a. Split.by | Label used to define comparison combinations (e.g., Group, Sample, etc.). |
b. Treatment Group | Name of the treatment group. |
c. Control | Name of the control group. |
d. Operation | Click "Delete" to remove the row, click "Add" in the top-left to add a new row. |
| Note | Custom remark information. |
Operation Workflow
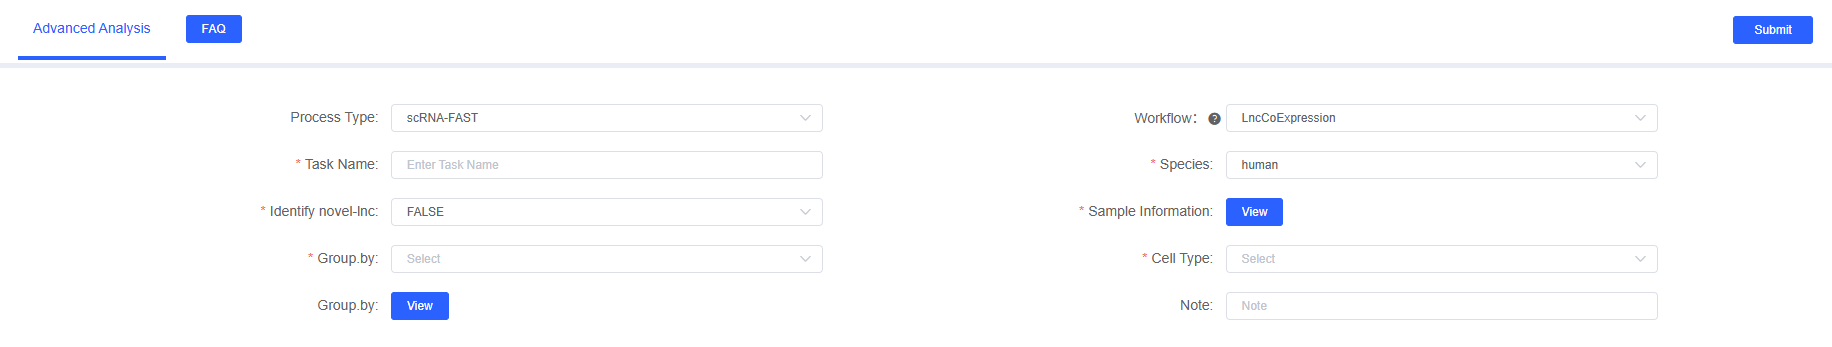
- Enter Analysis Module: Select "LncCoExpression" in the "Advanced Analysis" section of the SeekSoul™ Online.
- Create Task: Fill in "Task Name" and select "Species".
- Configure Input: Upload/select "Sample Information"; if novel-lnc detection is needed, provide
bam_pathand enable the corresponding parameter. - Define Objects: Set "Grouping Factor" and "Cell Type"; if comparison is needed, configure "Group Comparison".
- Submit and Wait: Confirm parameters, submit the task, and wait for computation to complete.
- Download and View: Download reports and result files from the task list, or directly preview charts on the page.
Result Interpretation
The LncCoExpression analysis report contains rich charts and data files. The following is a detailed interpretation of the core results.
5.1 lncRNA Expression Overview
5.1.1 Cell Cluster/Sample Distribution (UMAP)
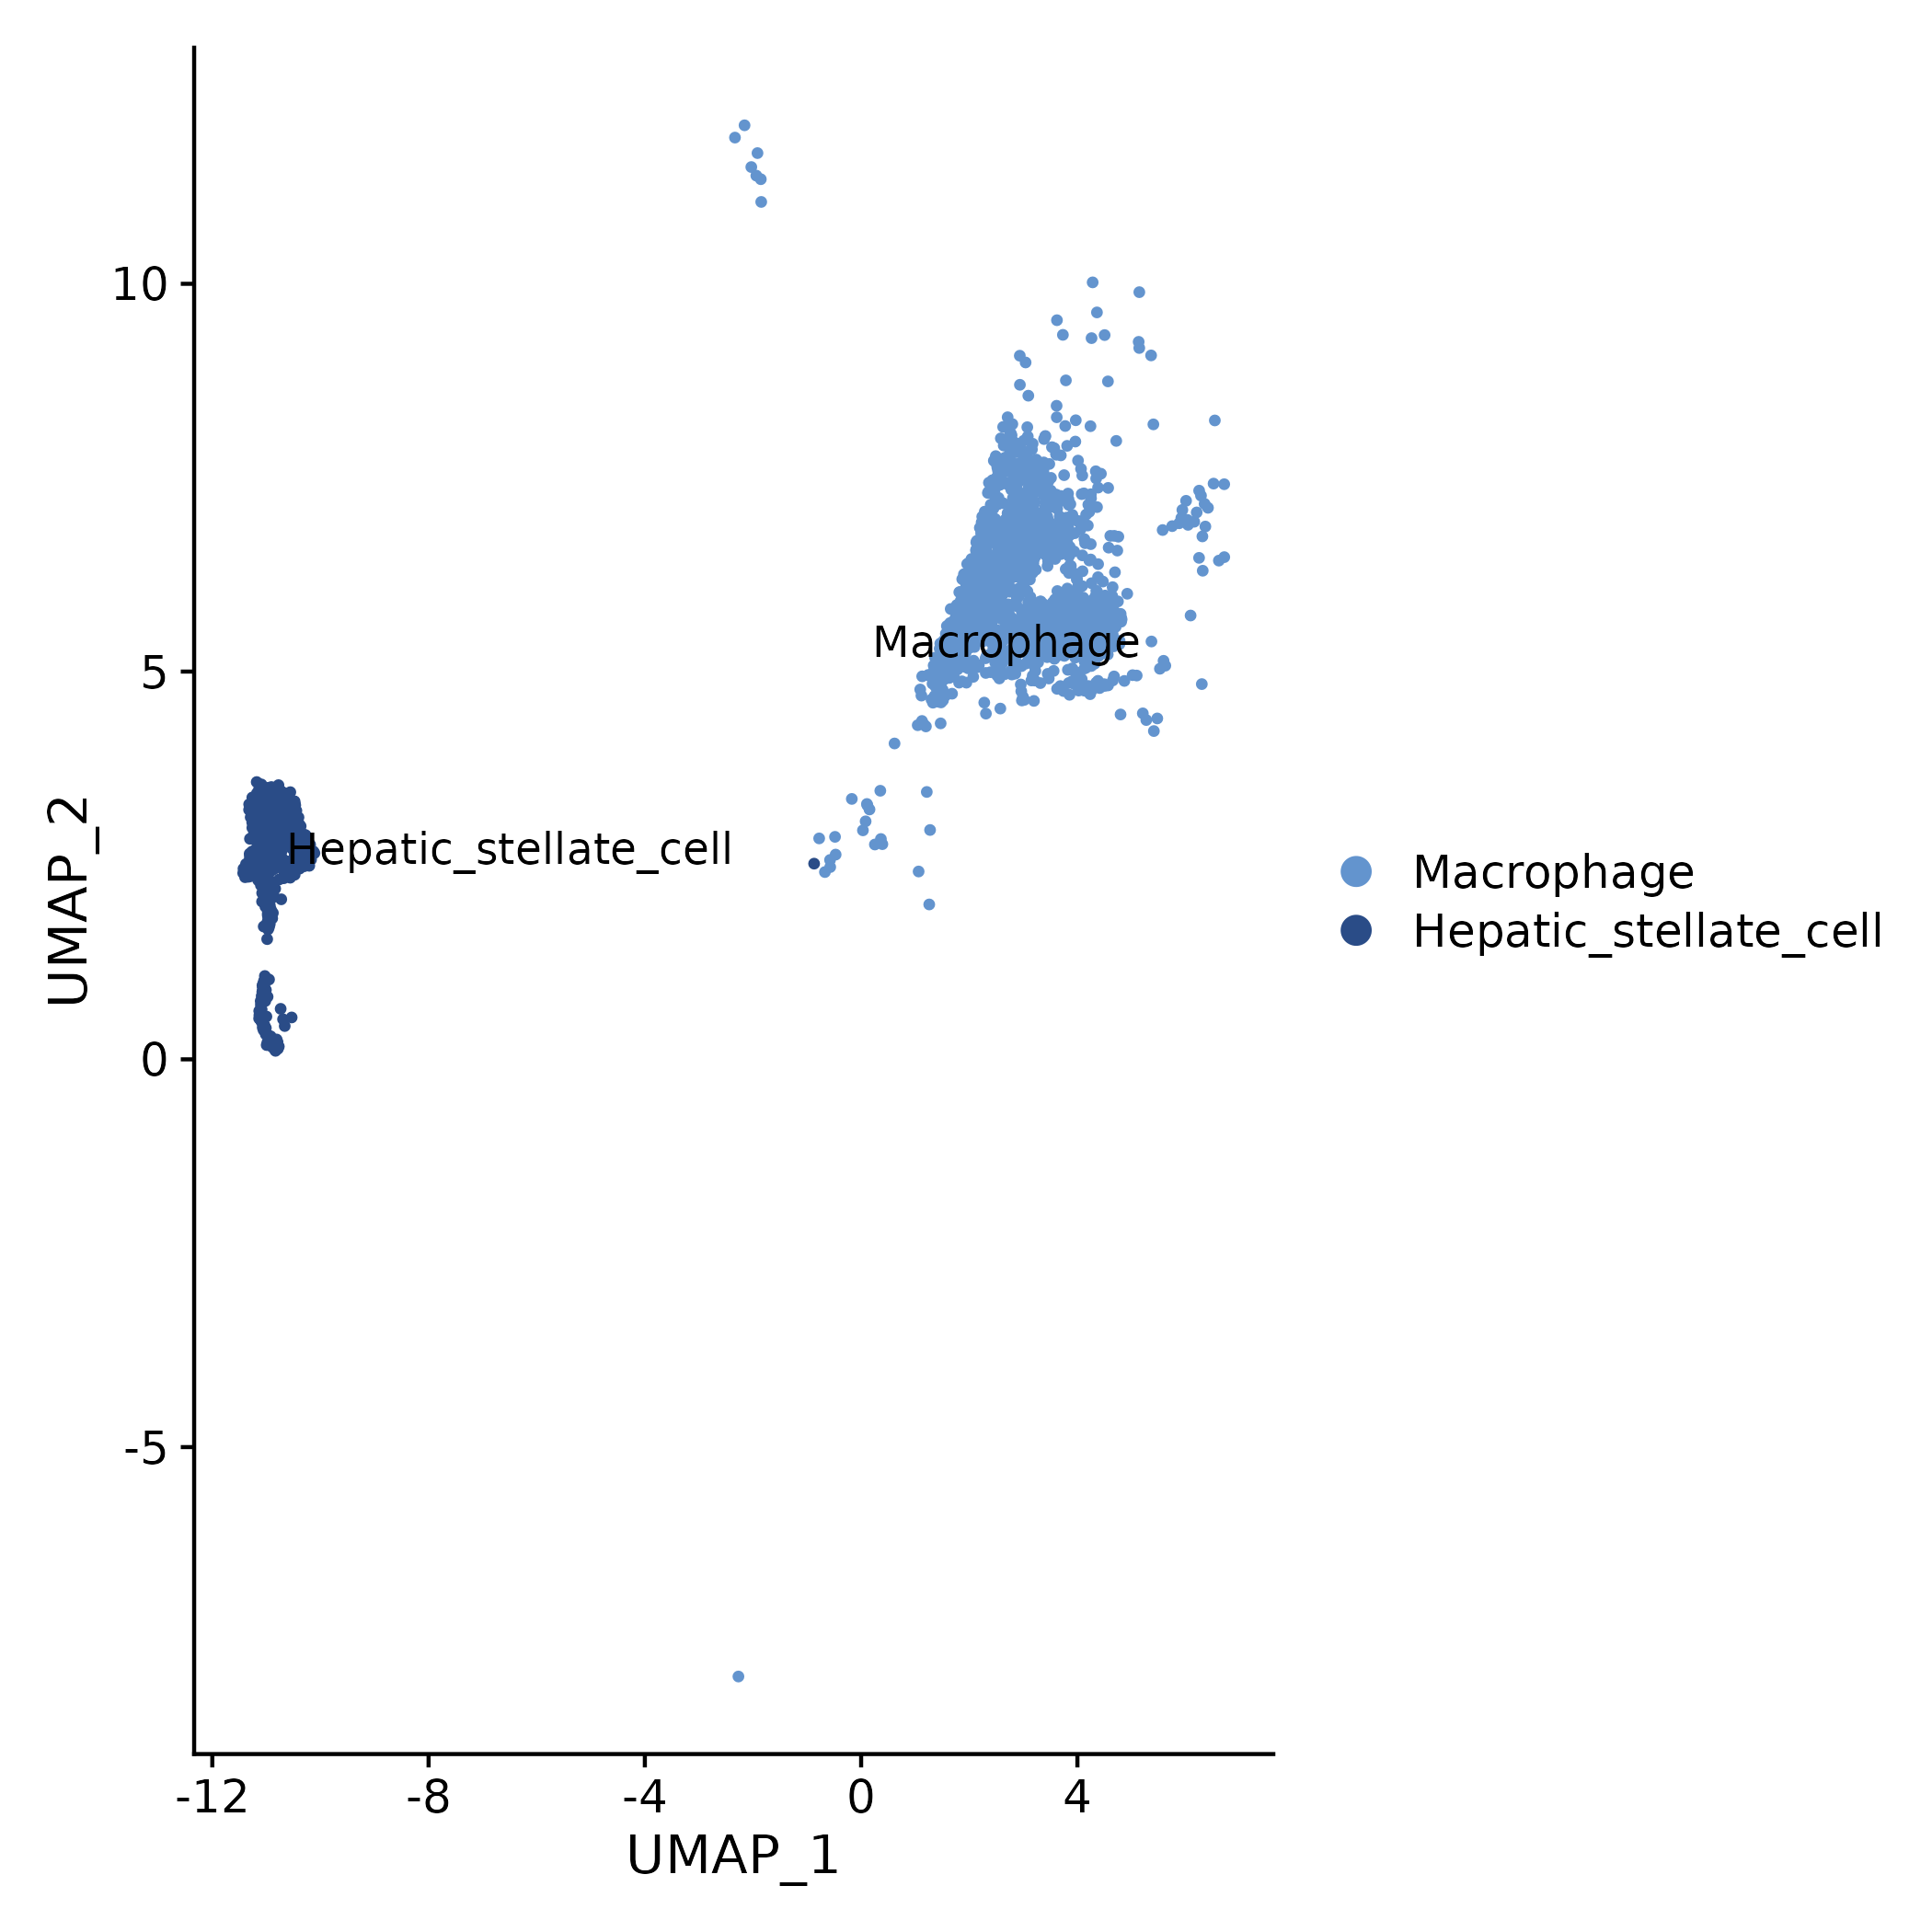
- Chart Interpretation: Each point represents a cell; different colors represent different clusters or sample groups.
- Analysis Points: Can initially observe the background composition and distribution differences of lncRNA analysis across different cell populations (or samples).
5.1.2 lncRNA Expression Percentage in Each Cluster
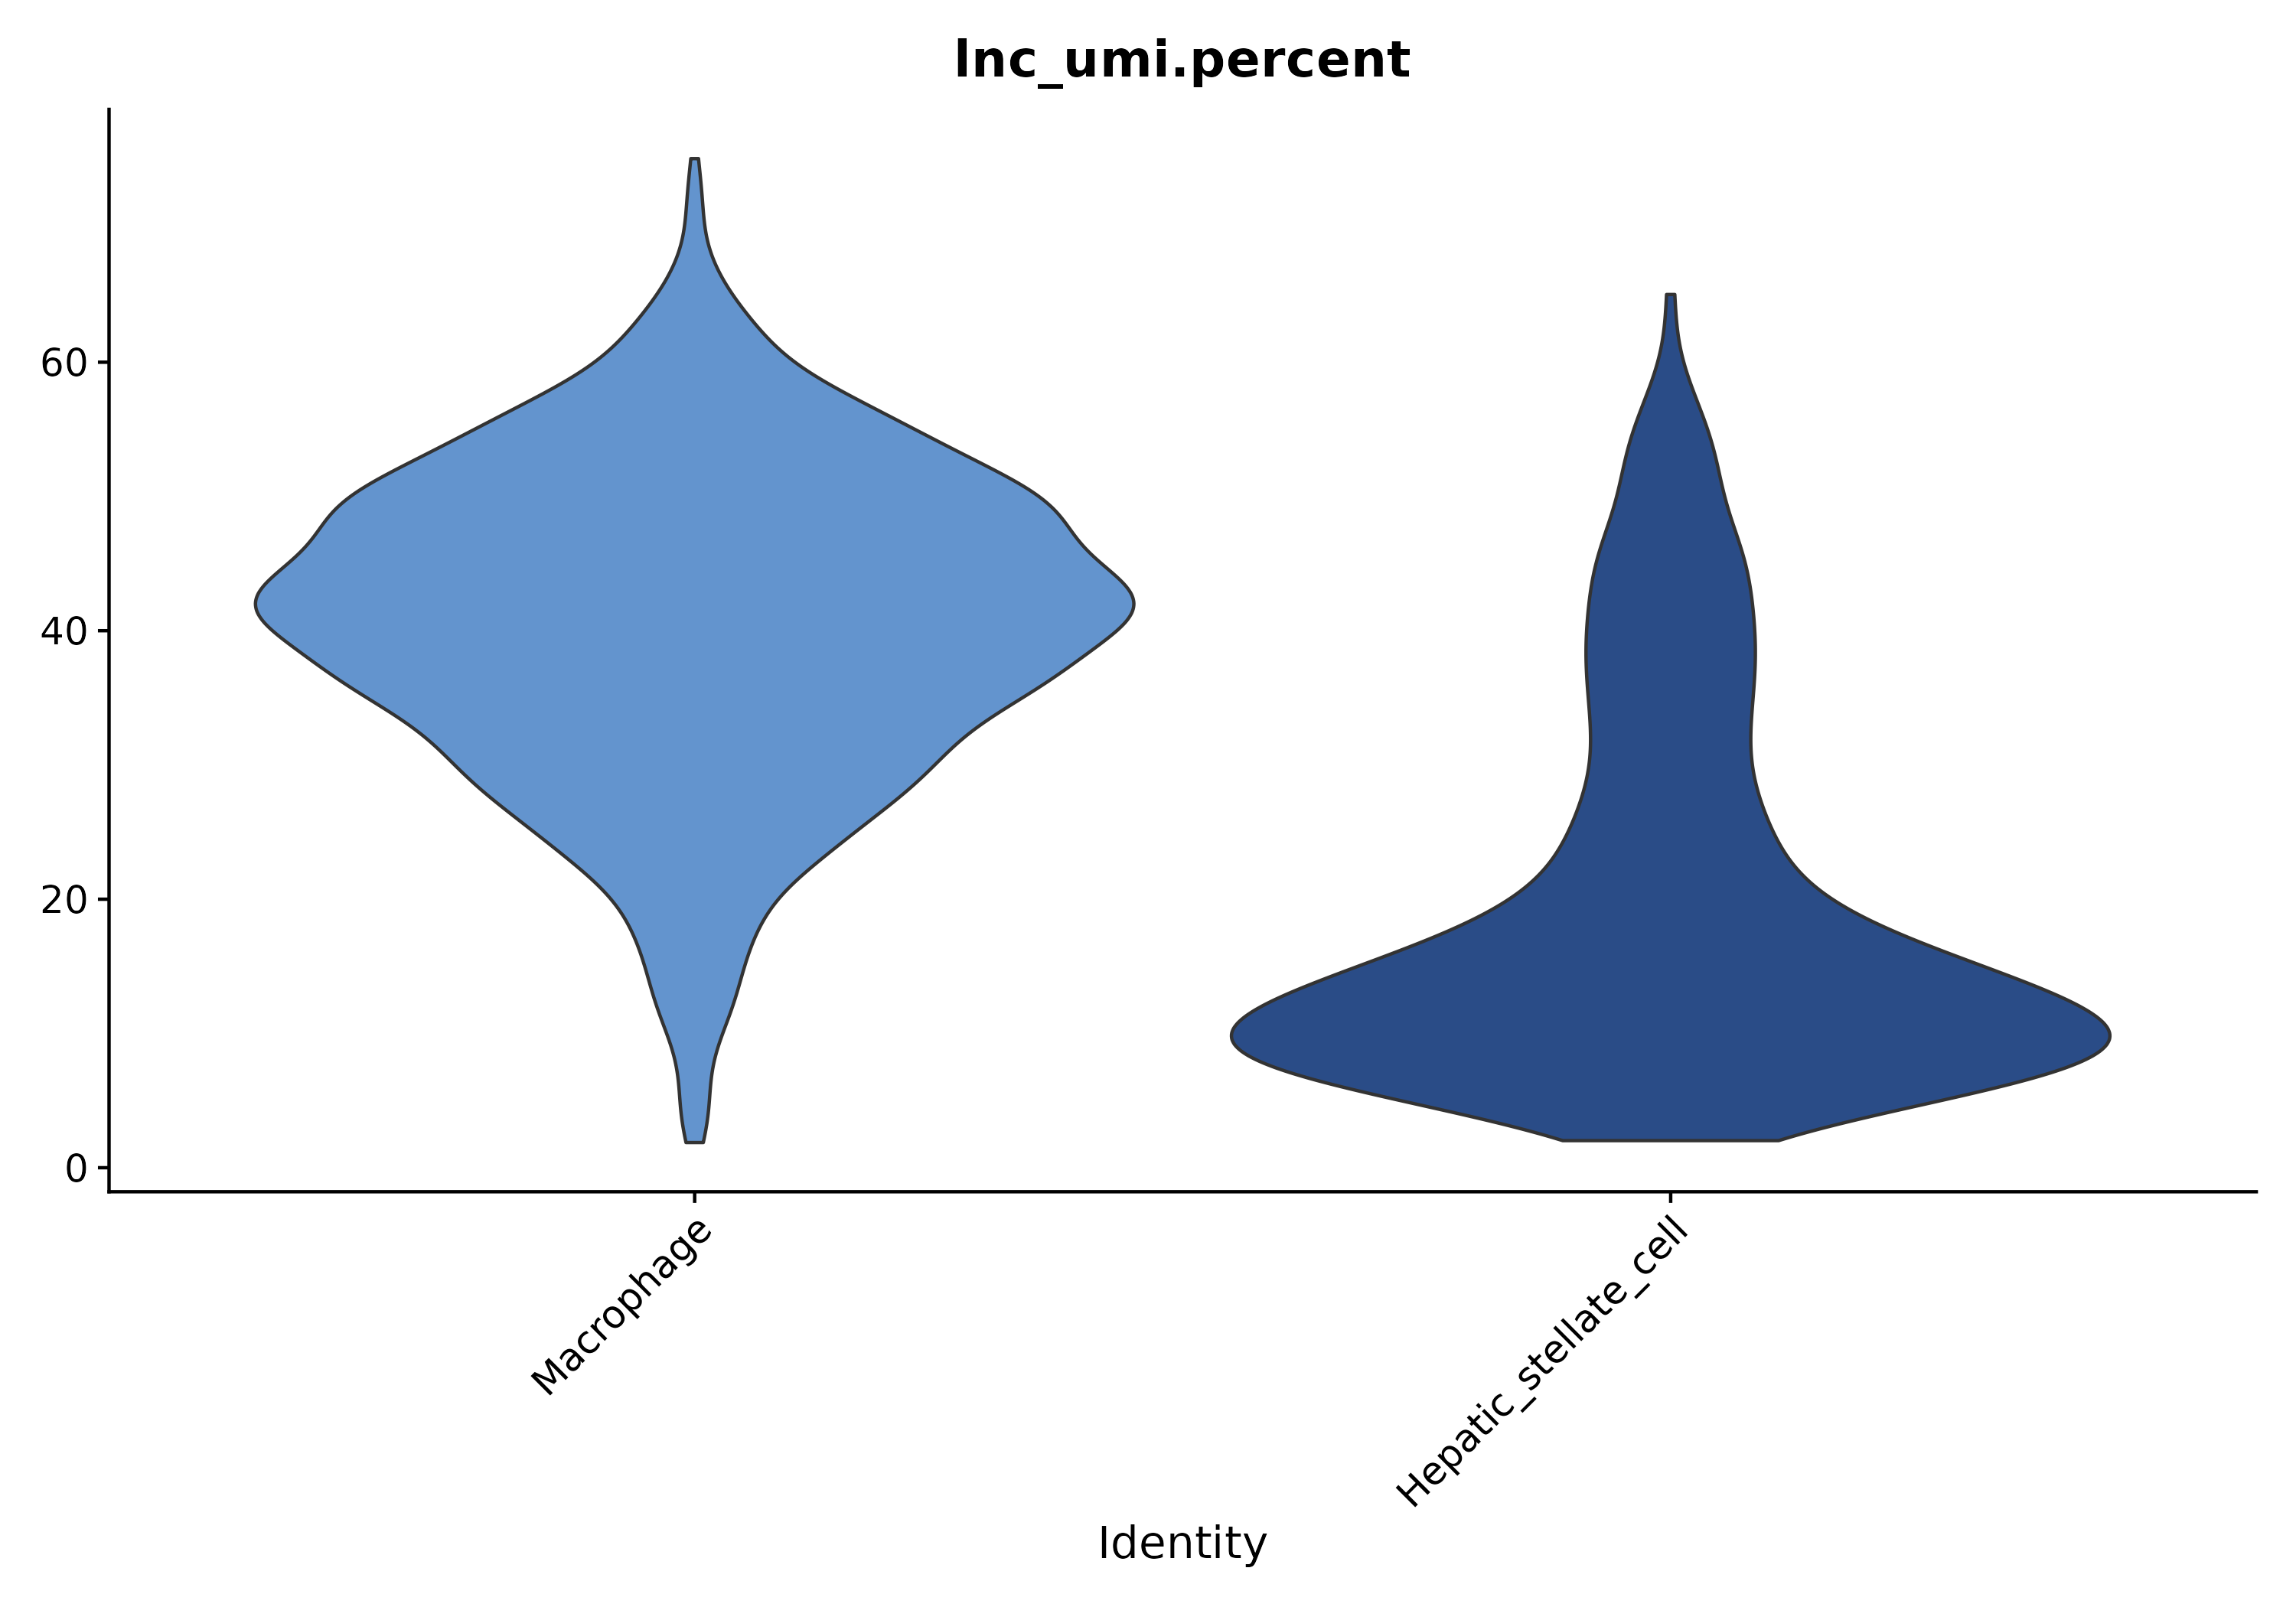
- Chart Interpretation: The x-axis shows cell clusters, and the y-axis shows the proportion of lncRNA UMI sum to total UMI in that cluster.
- Analysis Points: Used to assess differences in overall lncRNA expression levels across different cell clusters.
5.1.3 nCount/nFeature of lncRNA / protein-coding
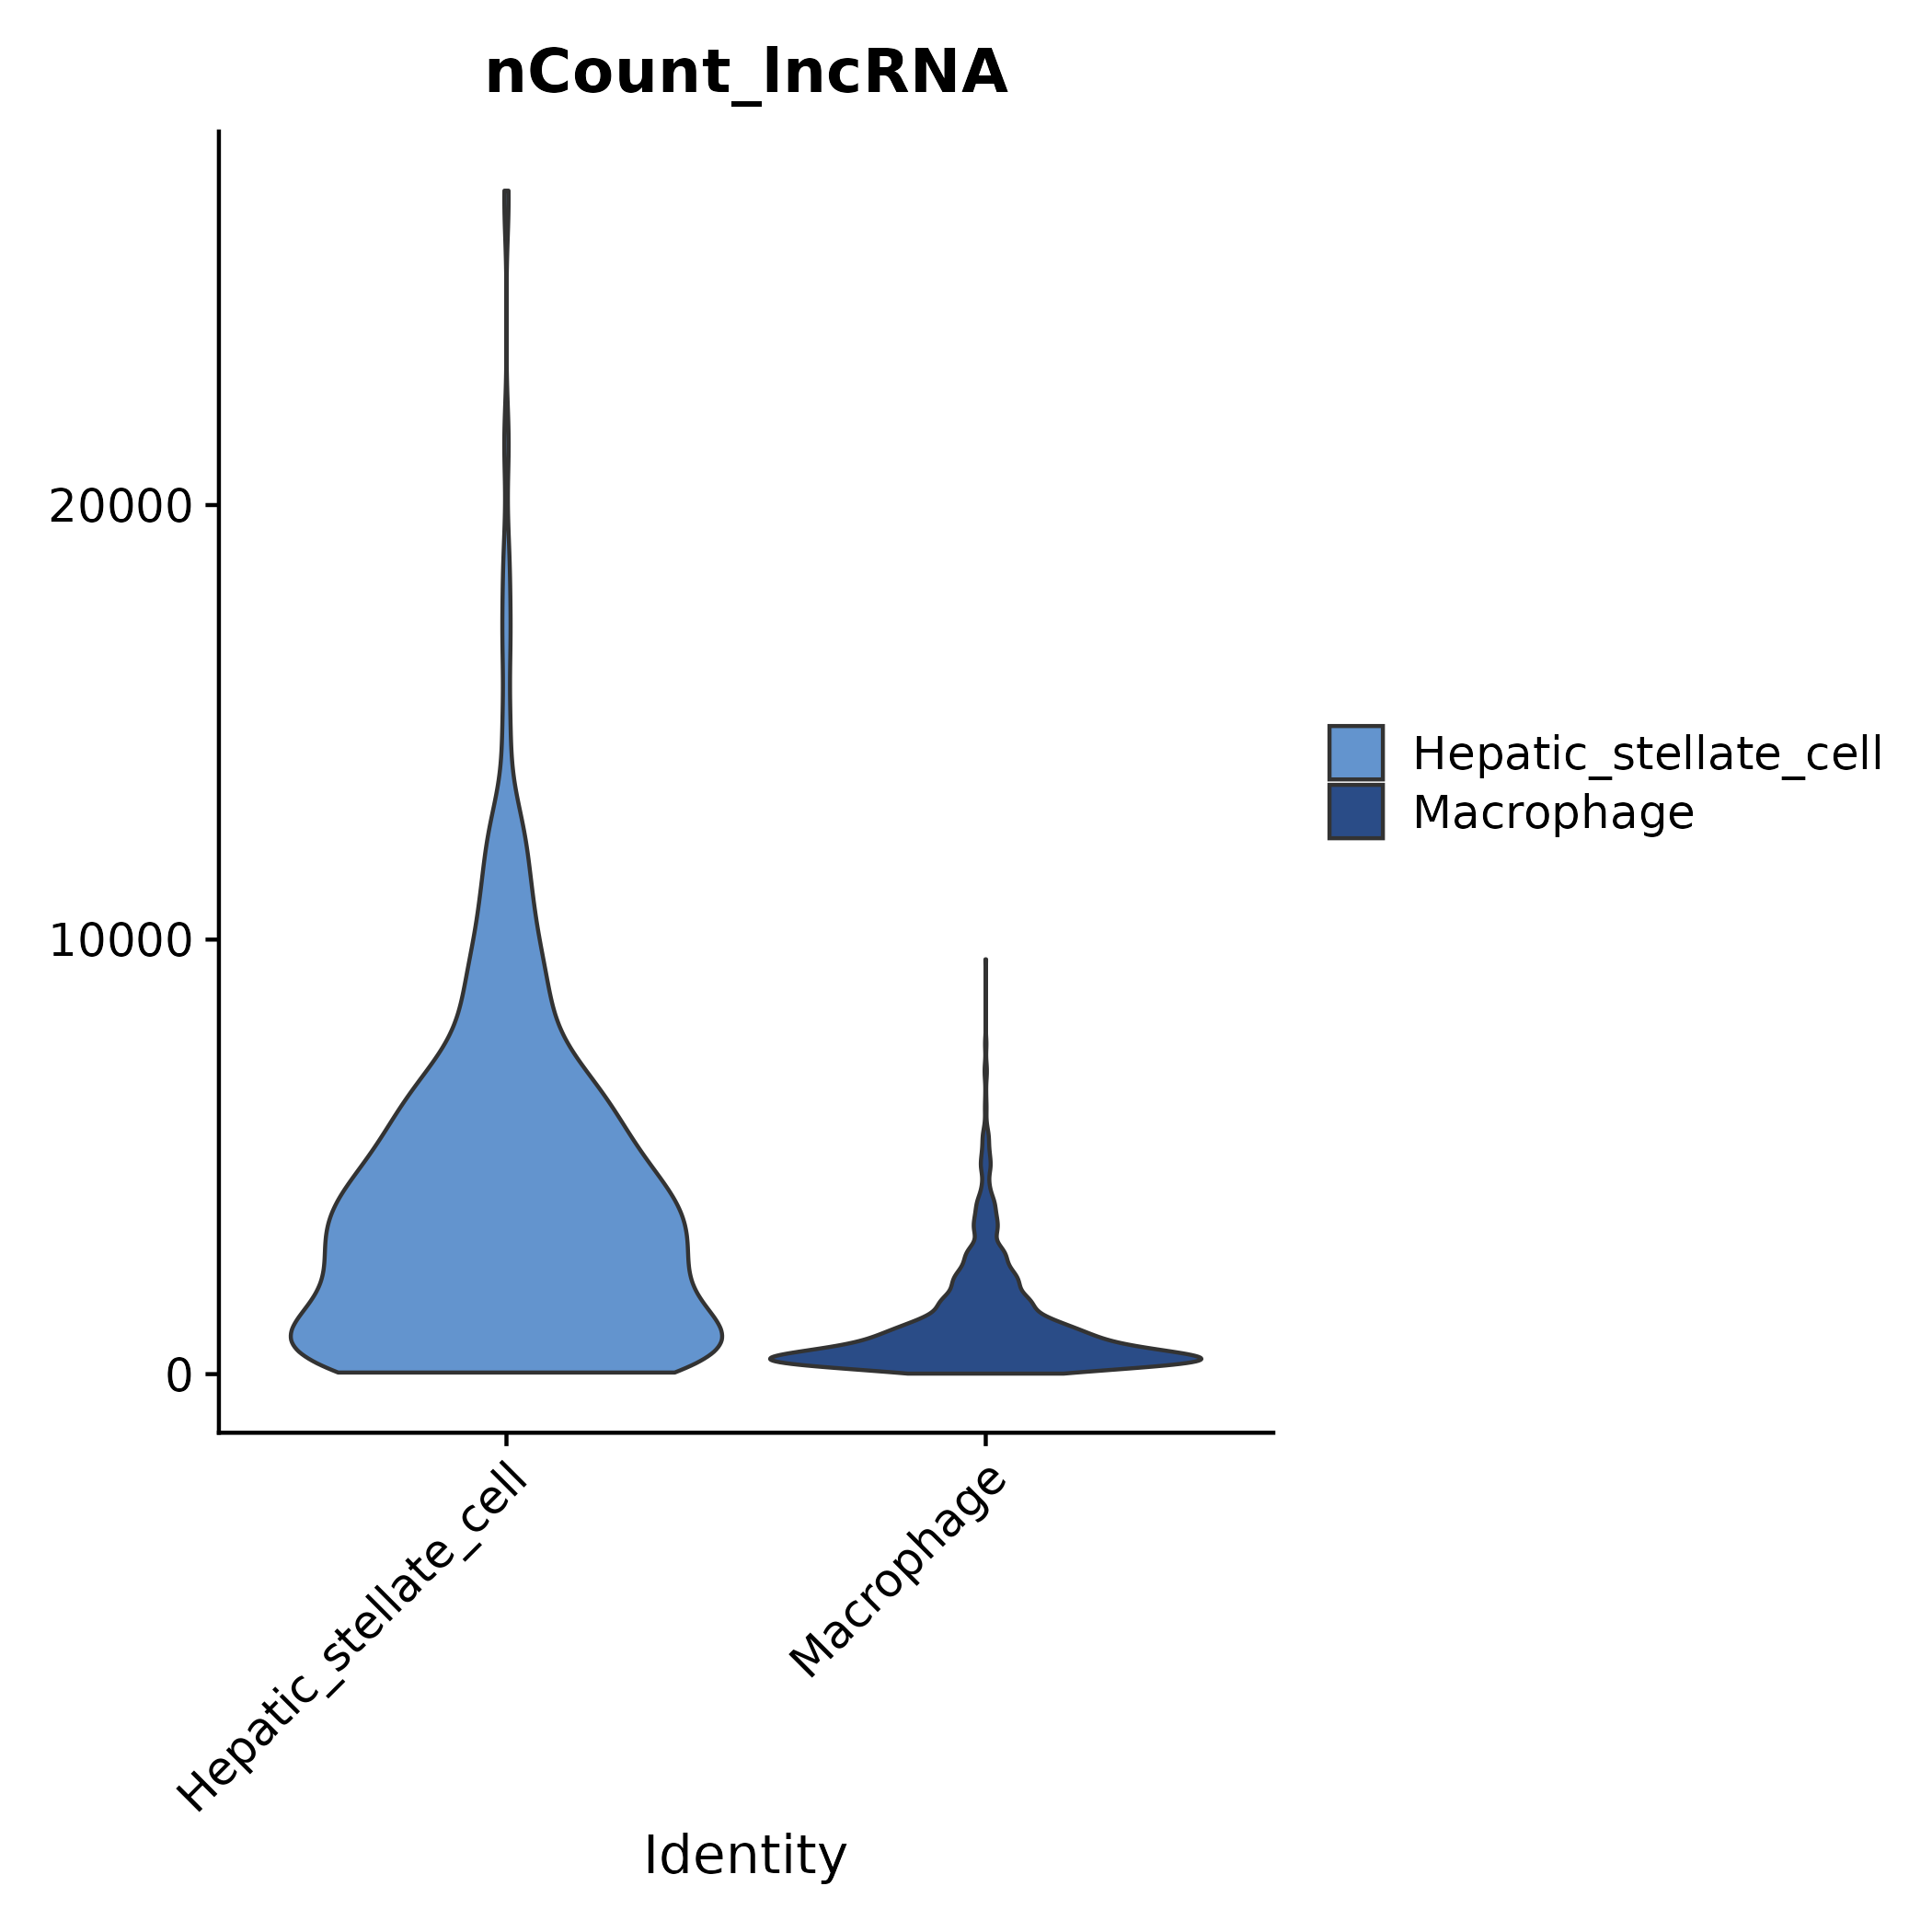
- Chart Interpretation: Shows the distribution of UMI (nCount) and gene count (nFeature) for lncRNAs and protein-coding RNAs across different cell clusters.
- Analysis Points: Helps assess the potential impact of sequencing depth and detected gene count in different clusters on subsequent differential and co-expression analyses.
5.2 Differentially Expressed Genes (DEGs)
- Method Description: Based on Seurat, default thresholds are
avg_log2FC ≥ 0.25andp_val_adj < 0.05. The differential set includes both lncRNAs and protein-coding genes.
5.2.1 Differential Gene Heatmap
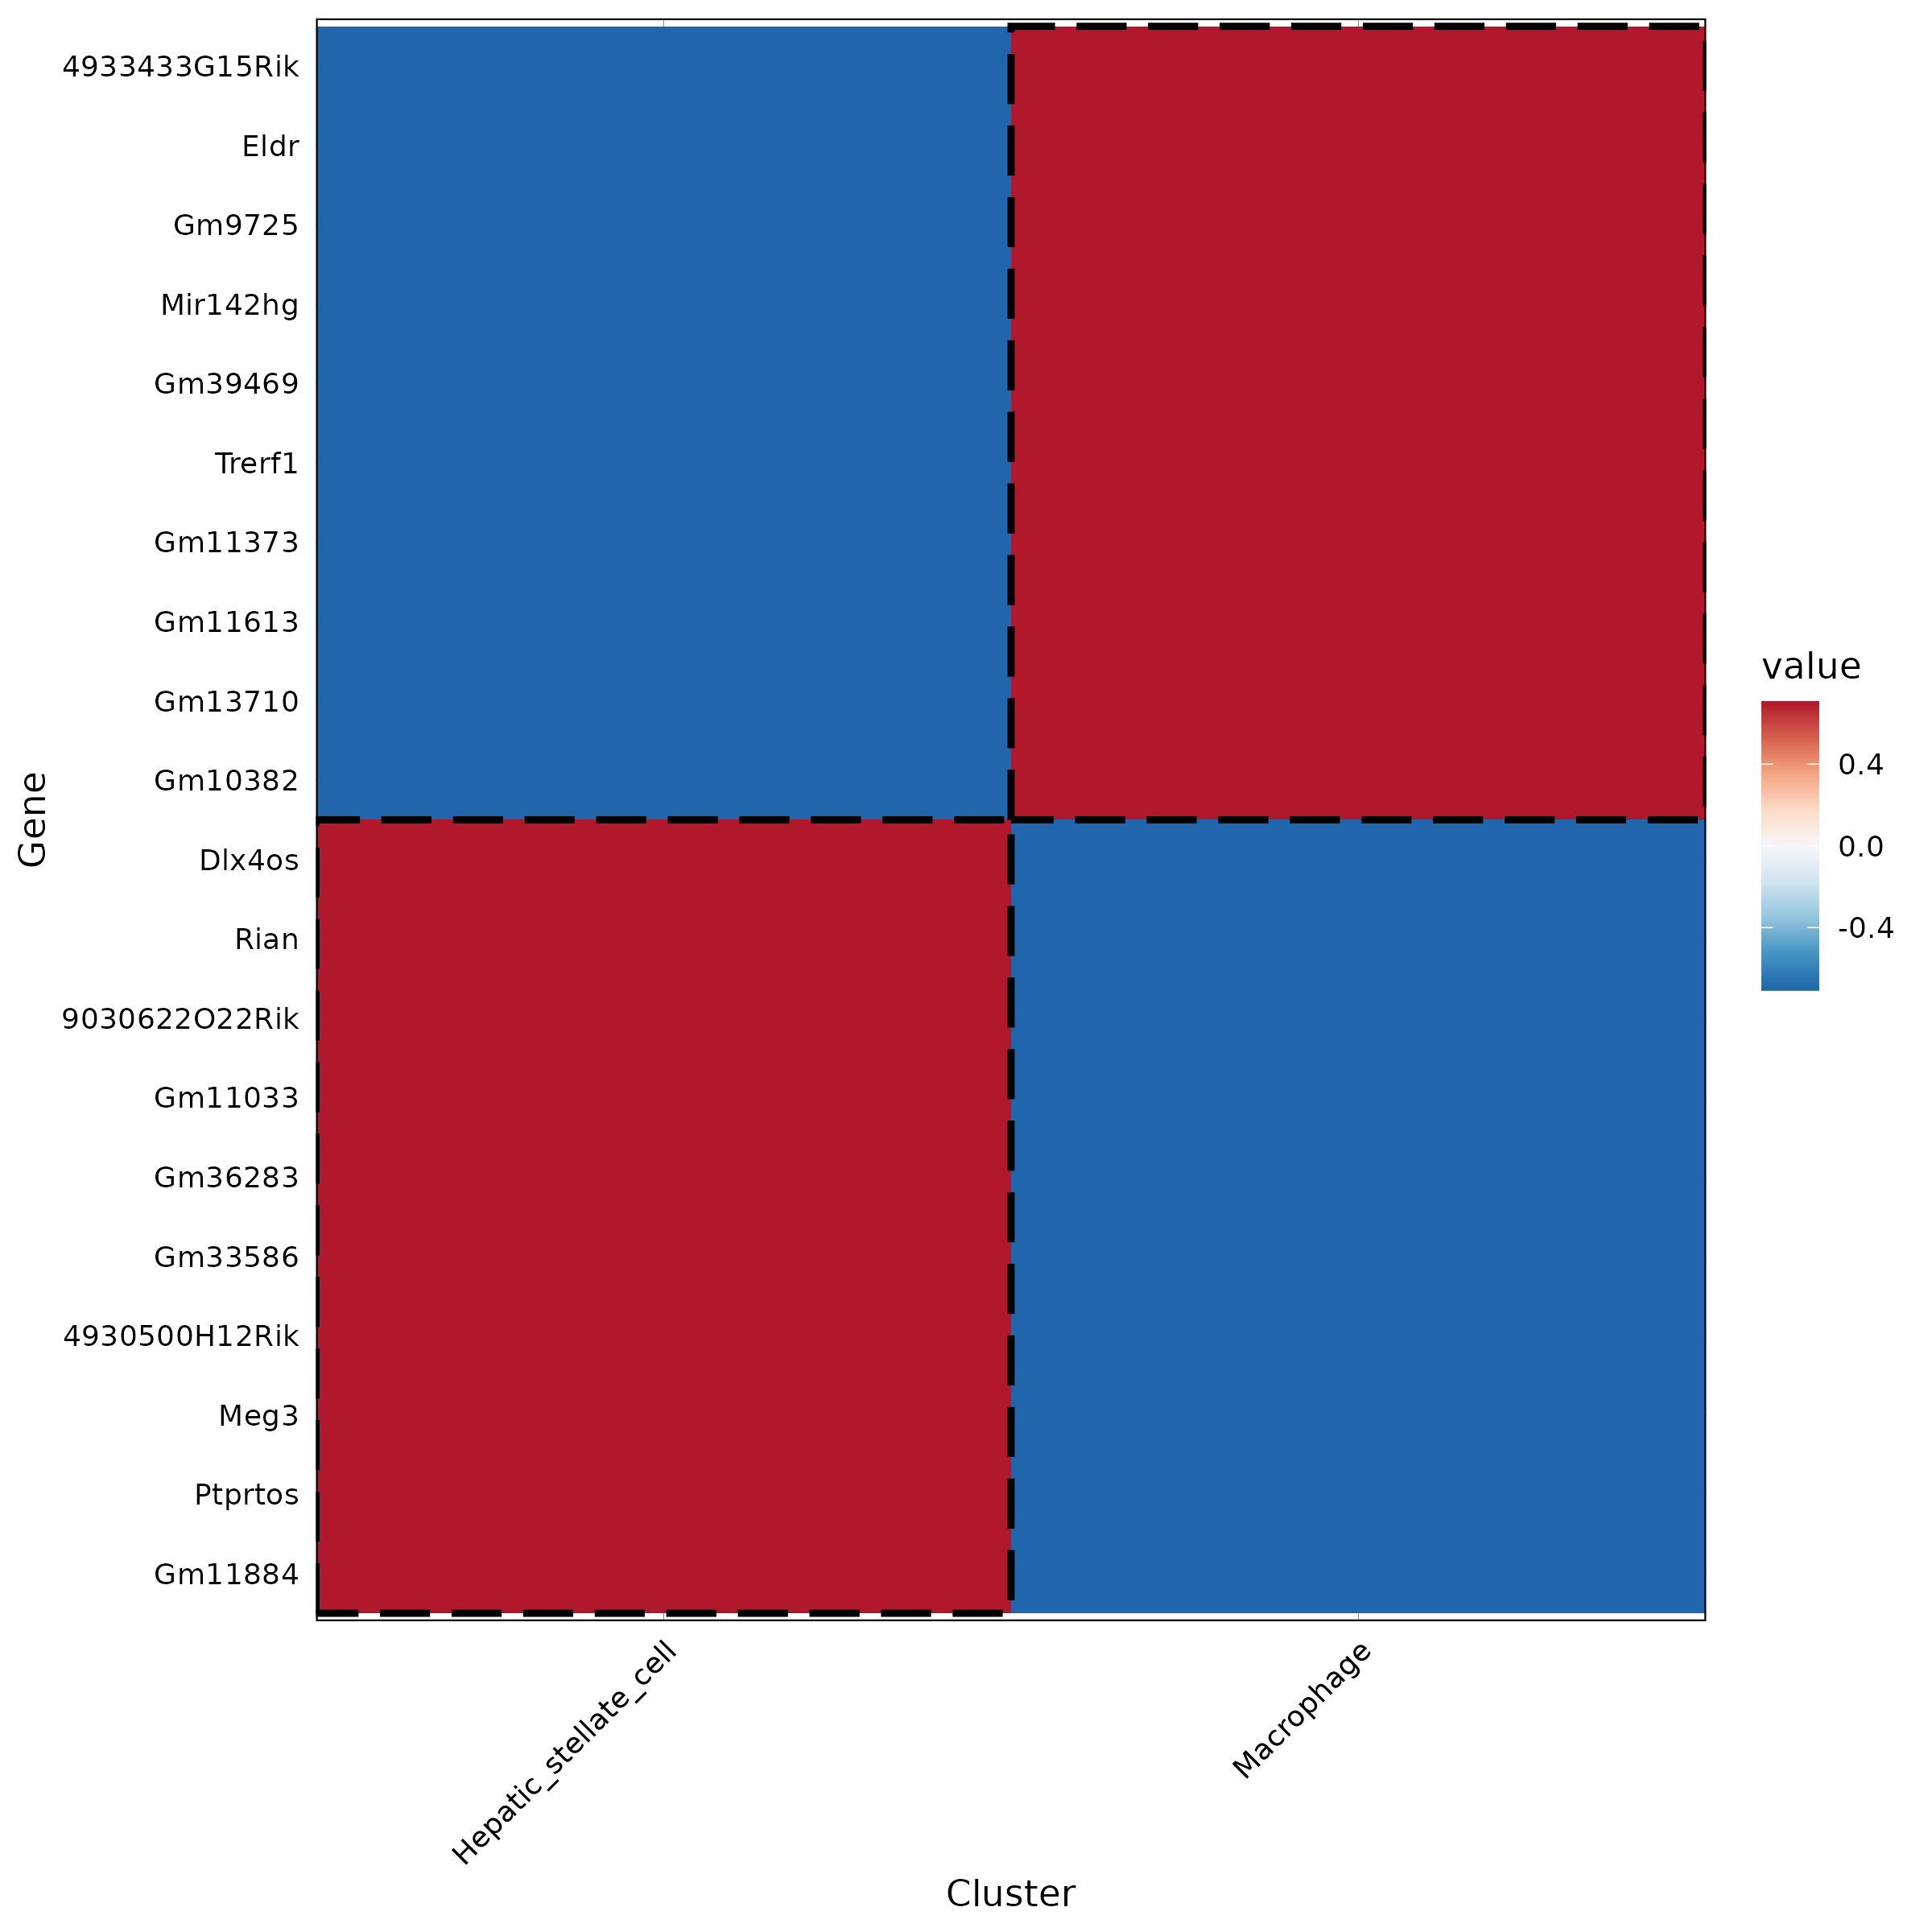
- Chart Interpretation: Each column represents a cell cluster (or group), showing the average expression levels of the top 10 differential genes (lncRNAs or protein-coding genes) in that cluster across all clusters. Colors typically represent normalized expression (e.g., Z-score), ranging from blue (low) to red (high).
- Analysis Points: Identify signature lncRNAs for each cluster and their co-expressed protein-coding genes; focus on genes highly expressed in the target cluster but lowly expressed in other clusters. These candidate sets will directly impact the construction and interpretation of subsequent networks and functional modules.
5.2.2 Specificity (Tau) Score
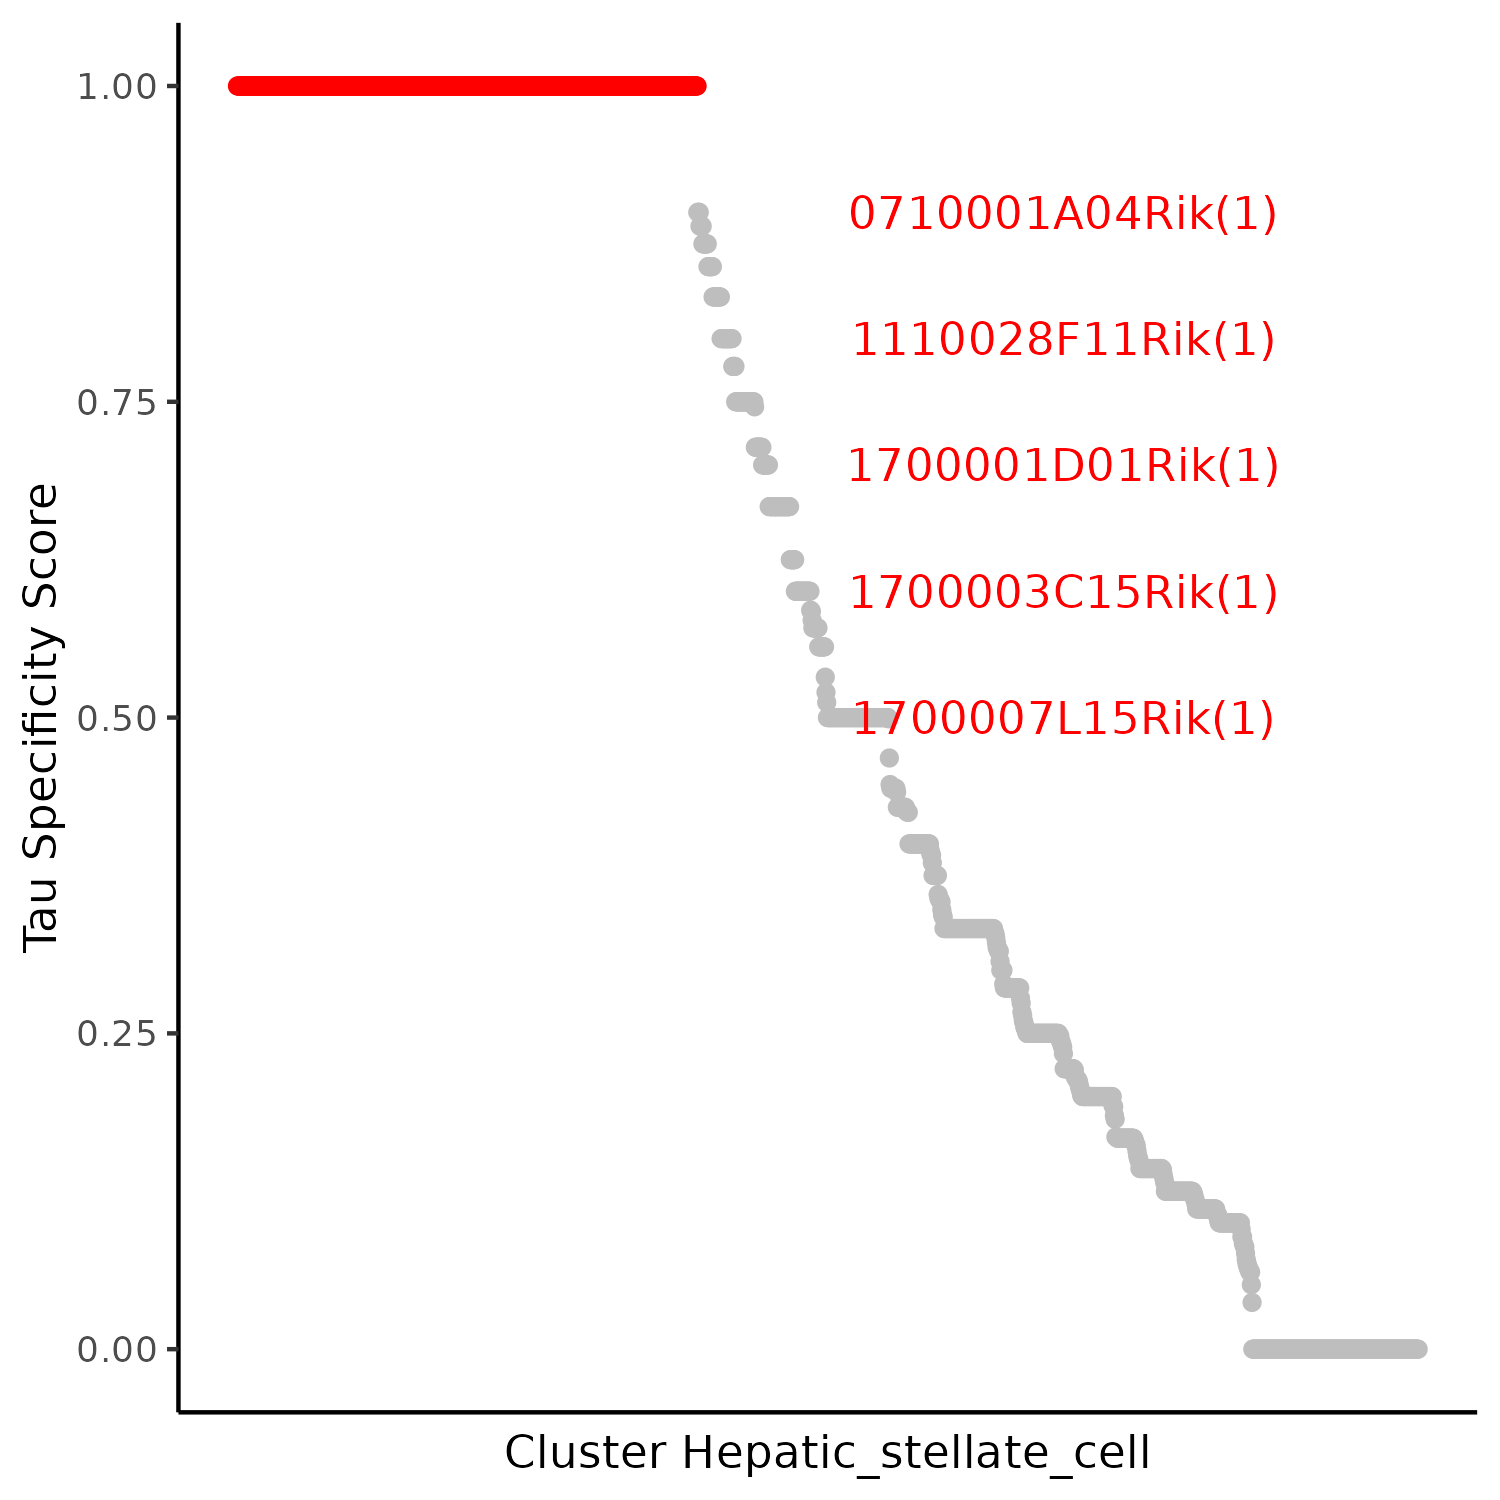
- Chart Interpretation: Each point represents an lncRNA, with Tau ranging from [0, 1]. Values closer to 1 indicate the lncRNA is highly specifically expressed in fewer clusters, while values closer to 0 indicate widespread expression across multiple clusters.
- Analysis Points: Prioritize lncRNAs with high Tau scores and statistical significance (or high expression/effect size) as candidate regulatory factors; combine with differential analysis and network centrality indicators for more robust screening.
5.2.3 Single Gene Visualization (Top 4 lncRNAs in Example Cluster)
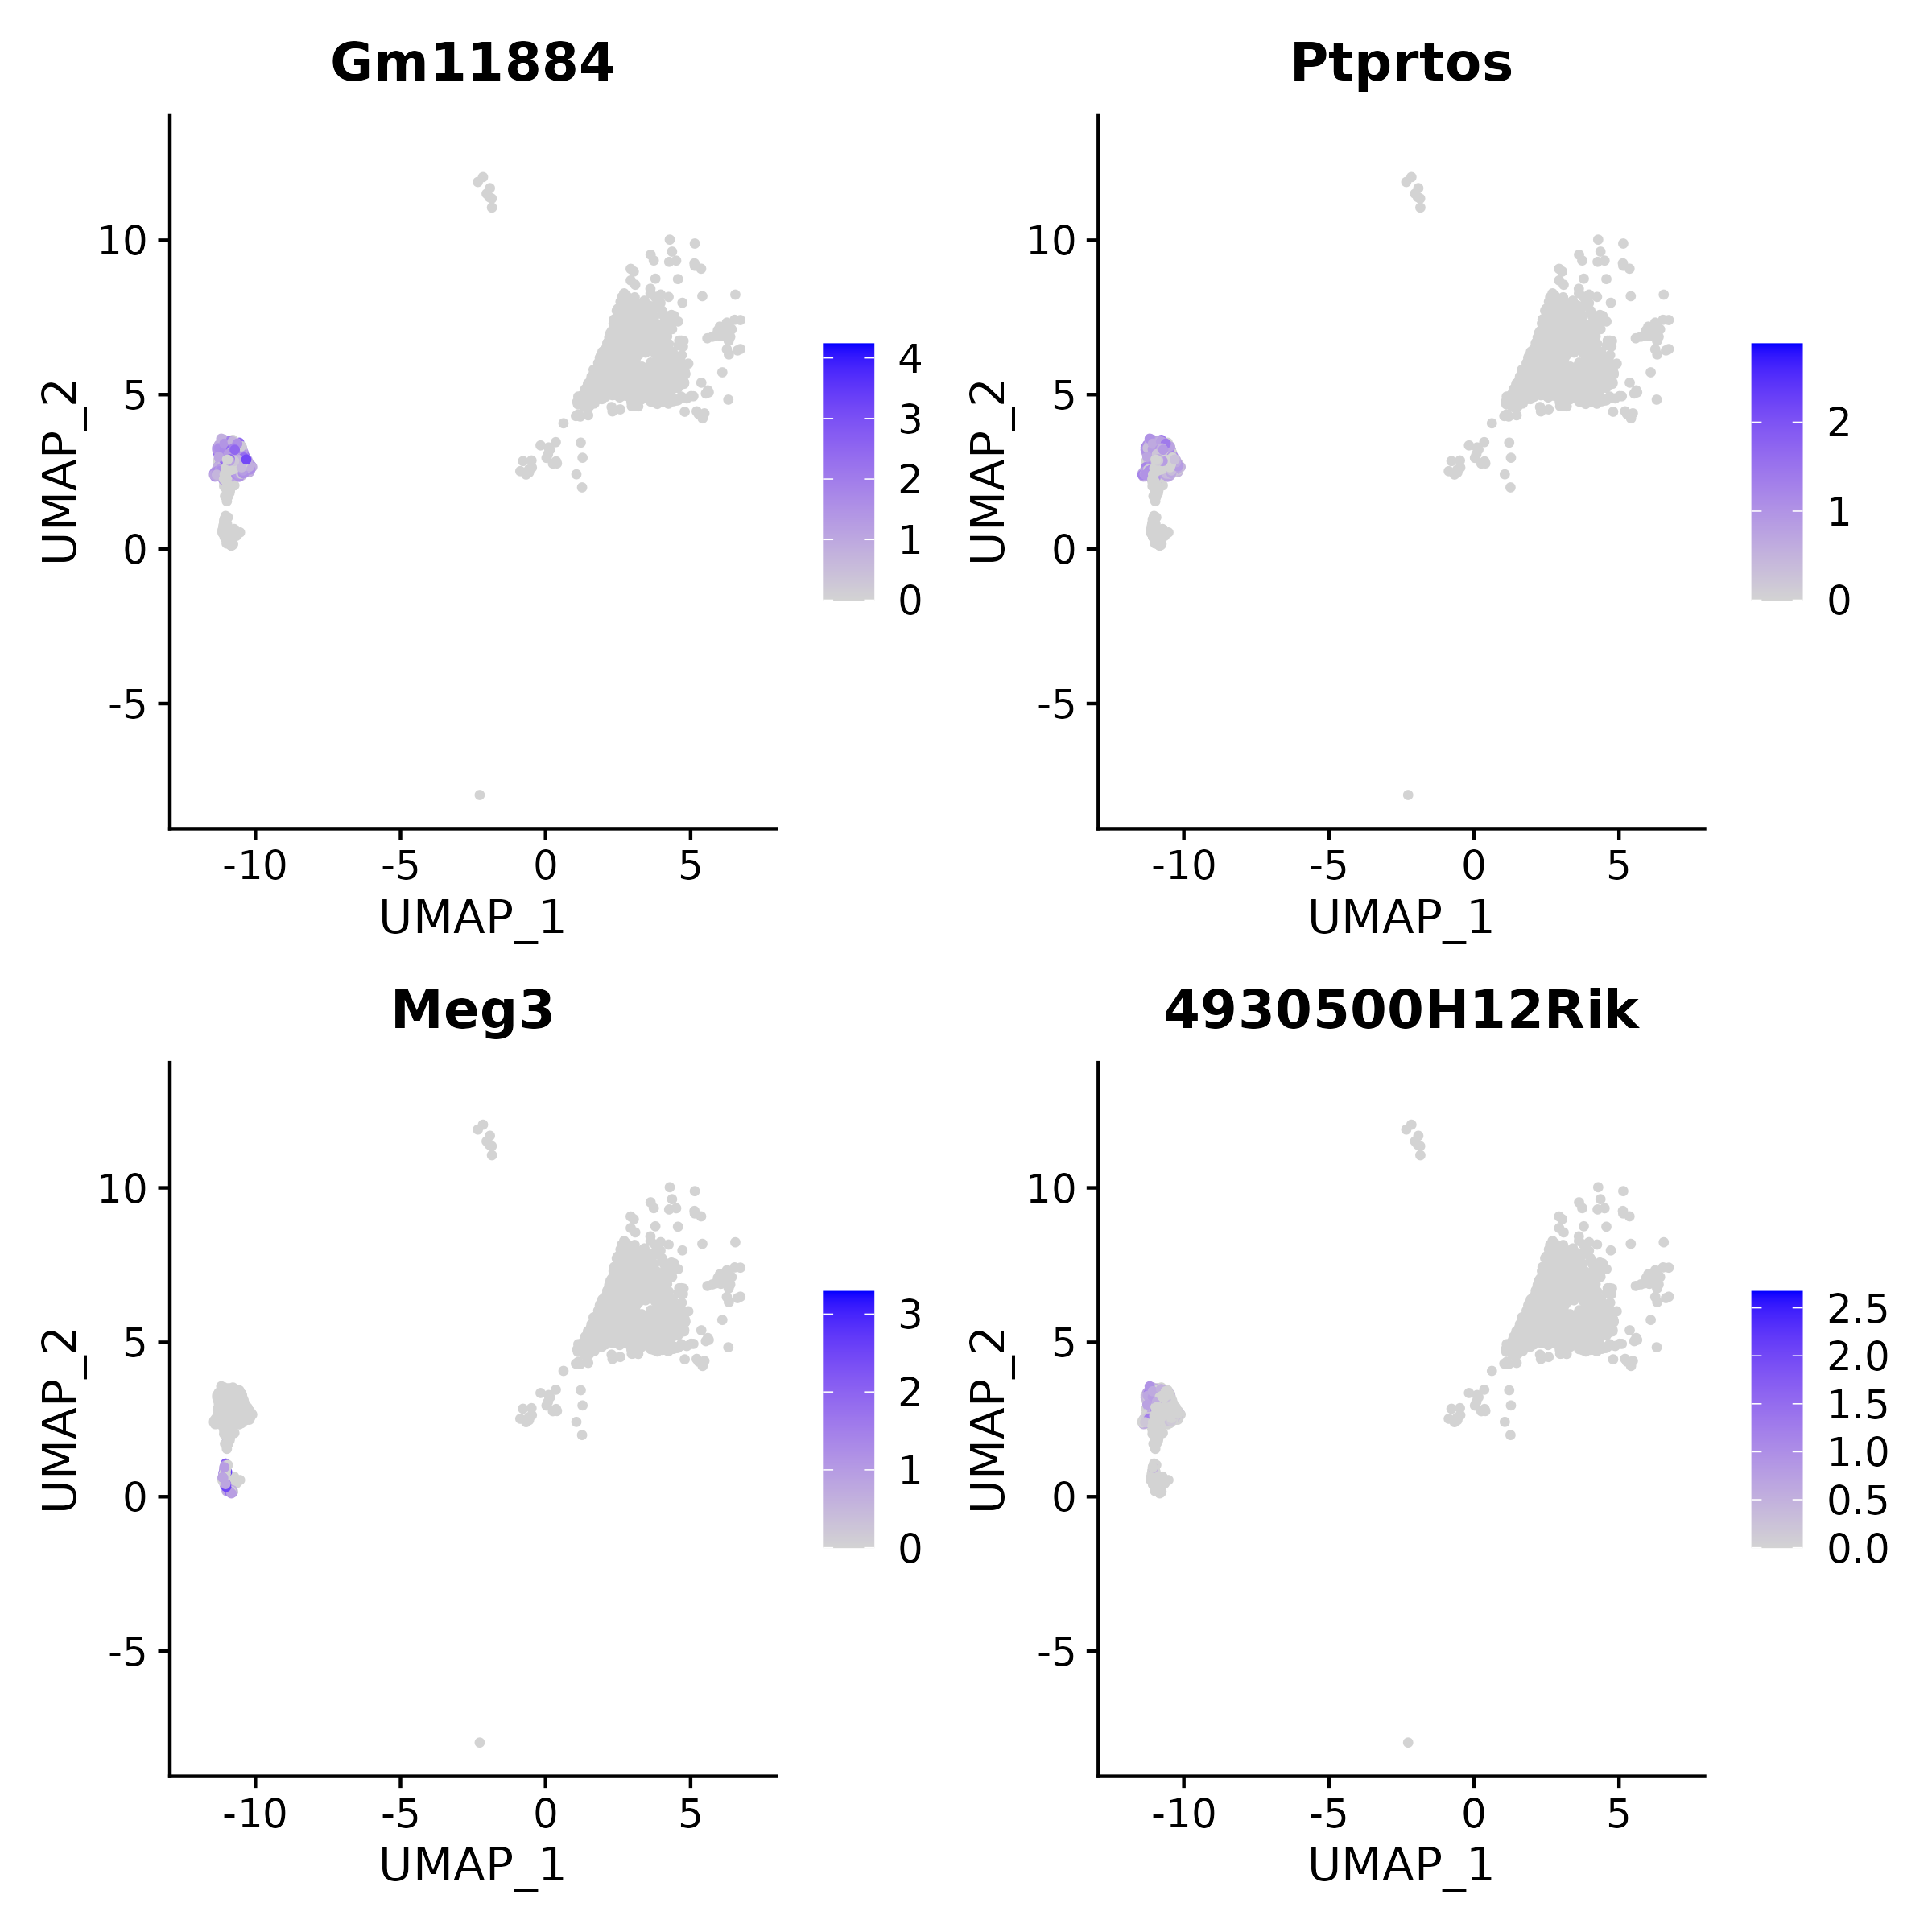
- Chart Interpretation: Shows the expression distribution of individual lncRNAs in UMAP space, with color intensity representing expression levels. Darker blue indicates higher expression of the differential lncRNA in cell clusters, and intuitively shows its enrichment across different cell clusters/spatial locations.
- Analysis Points: Used to verify the spatial/cluster specificity of candidate lncRNAs and cross-validate with cell type annotations; focal high expression consistent with functional relevant clusters provides stronger support for it being a key molecule.
TIP
By combining differential expression and specificity analysis, highly specifically expressed candidate lncRNAs can be quickly identified, providing target sets for downstream network and mechanism studies.
5.3 lncRNA Co-expression Network (By Cluster)
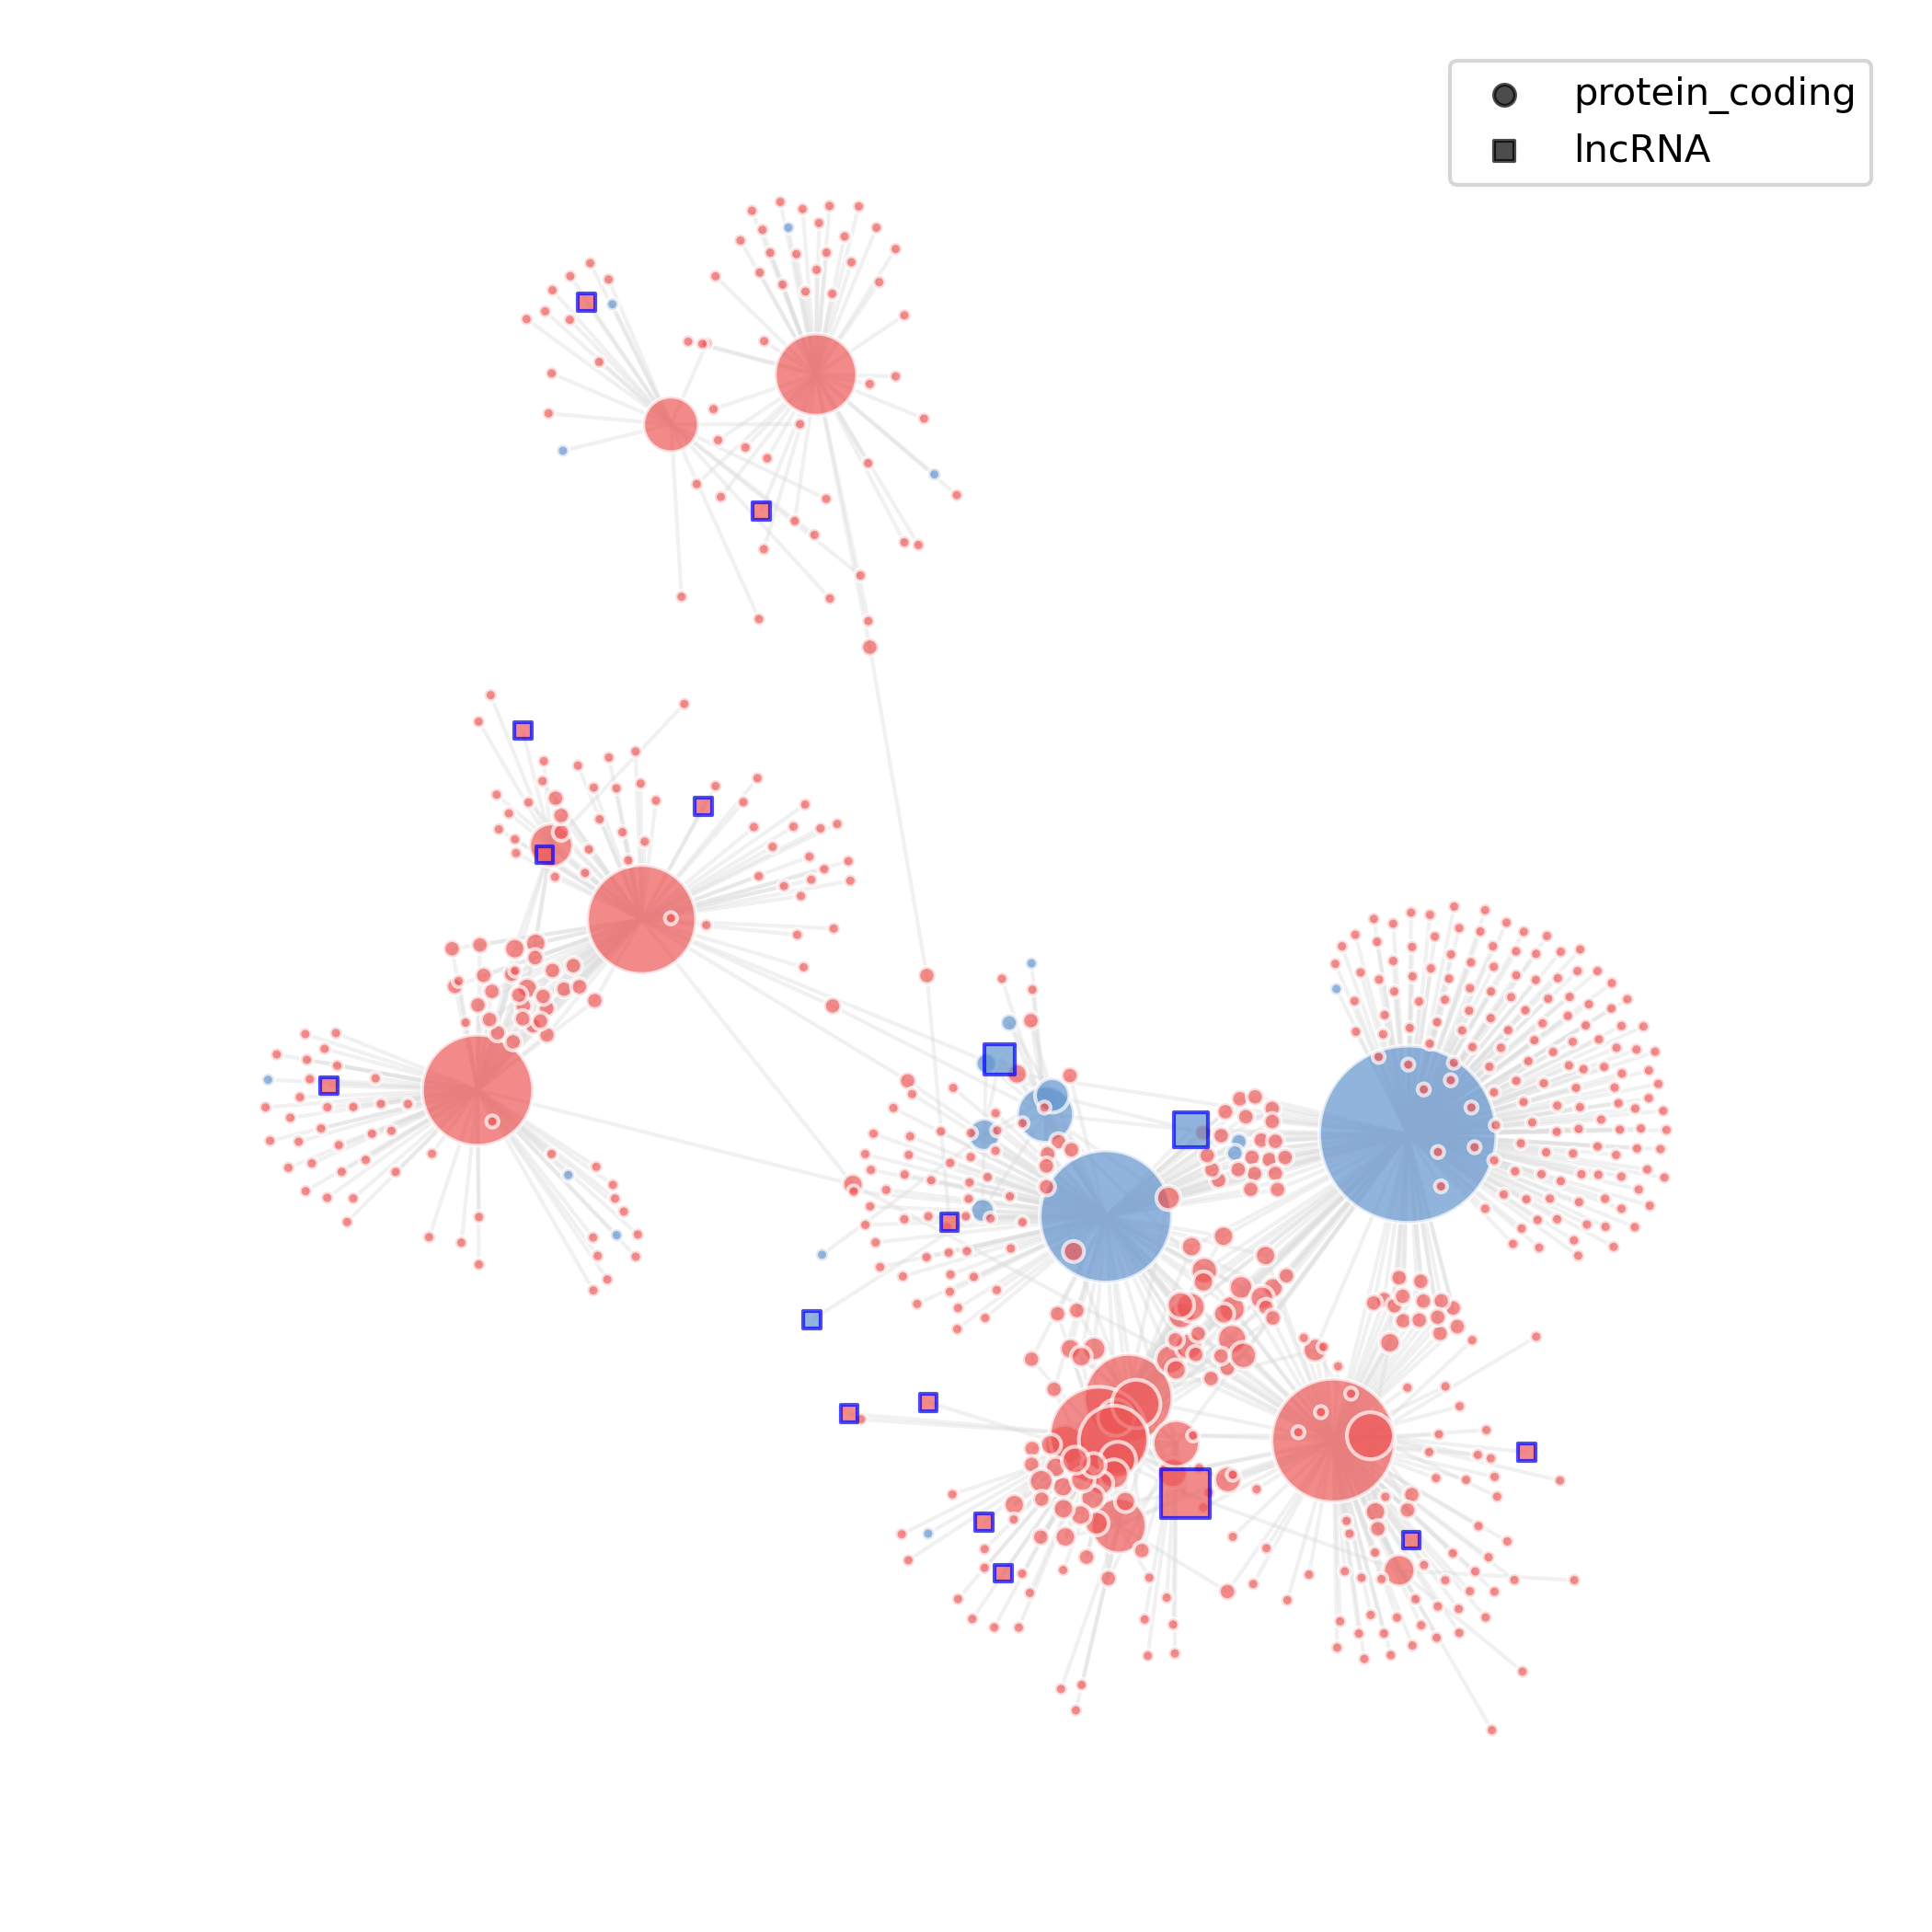
5.3.1 Network Diagram
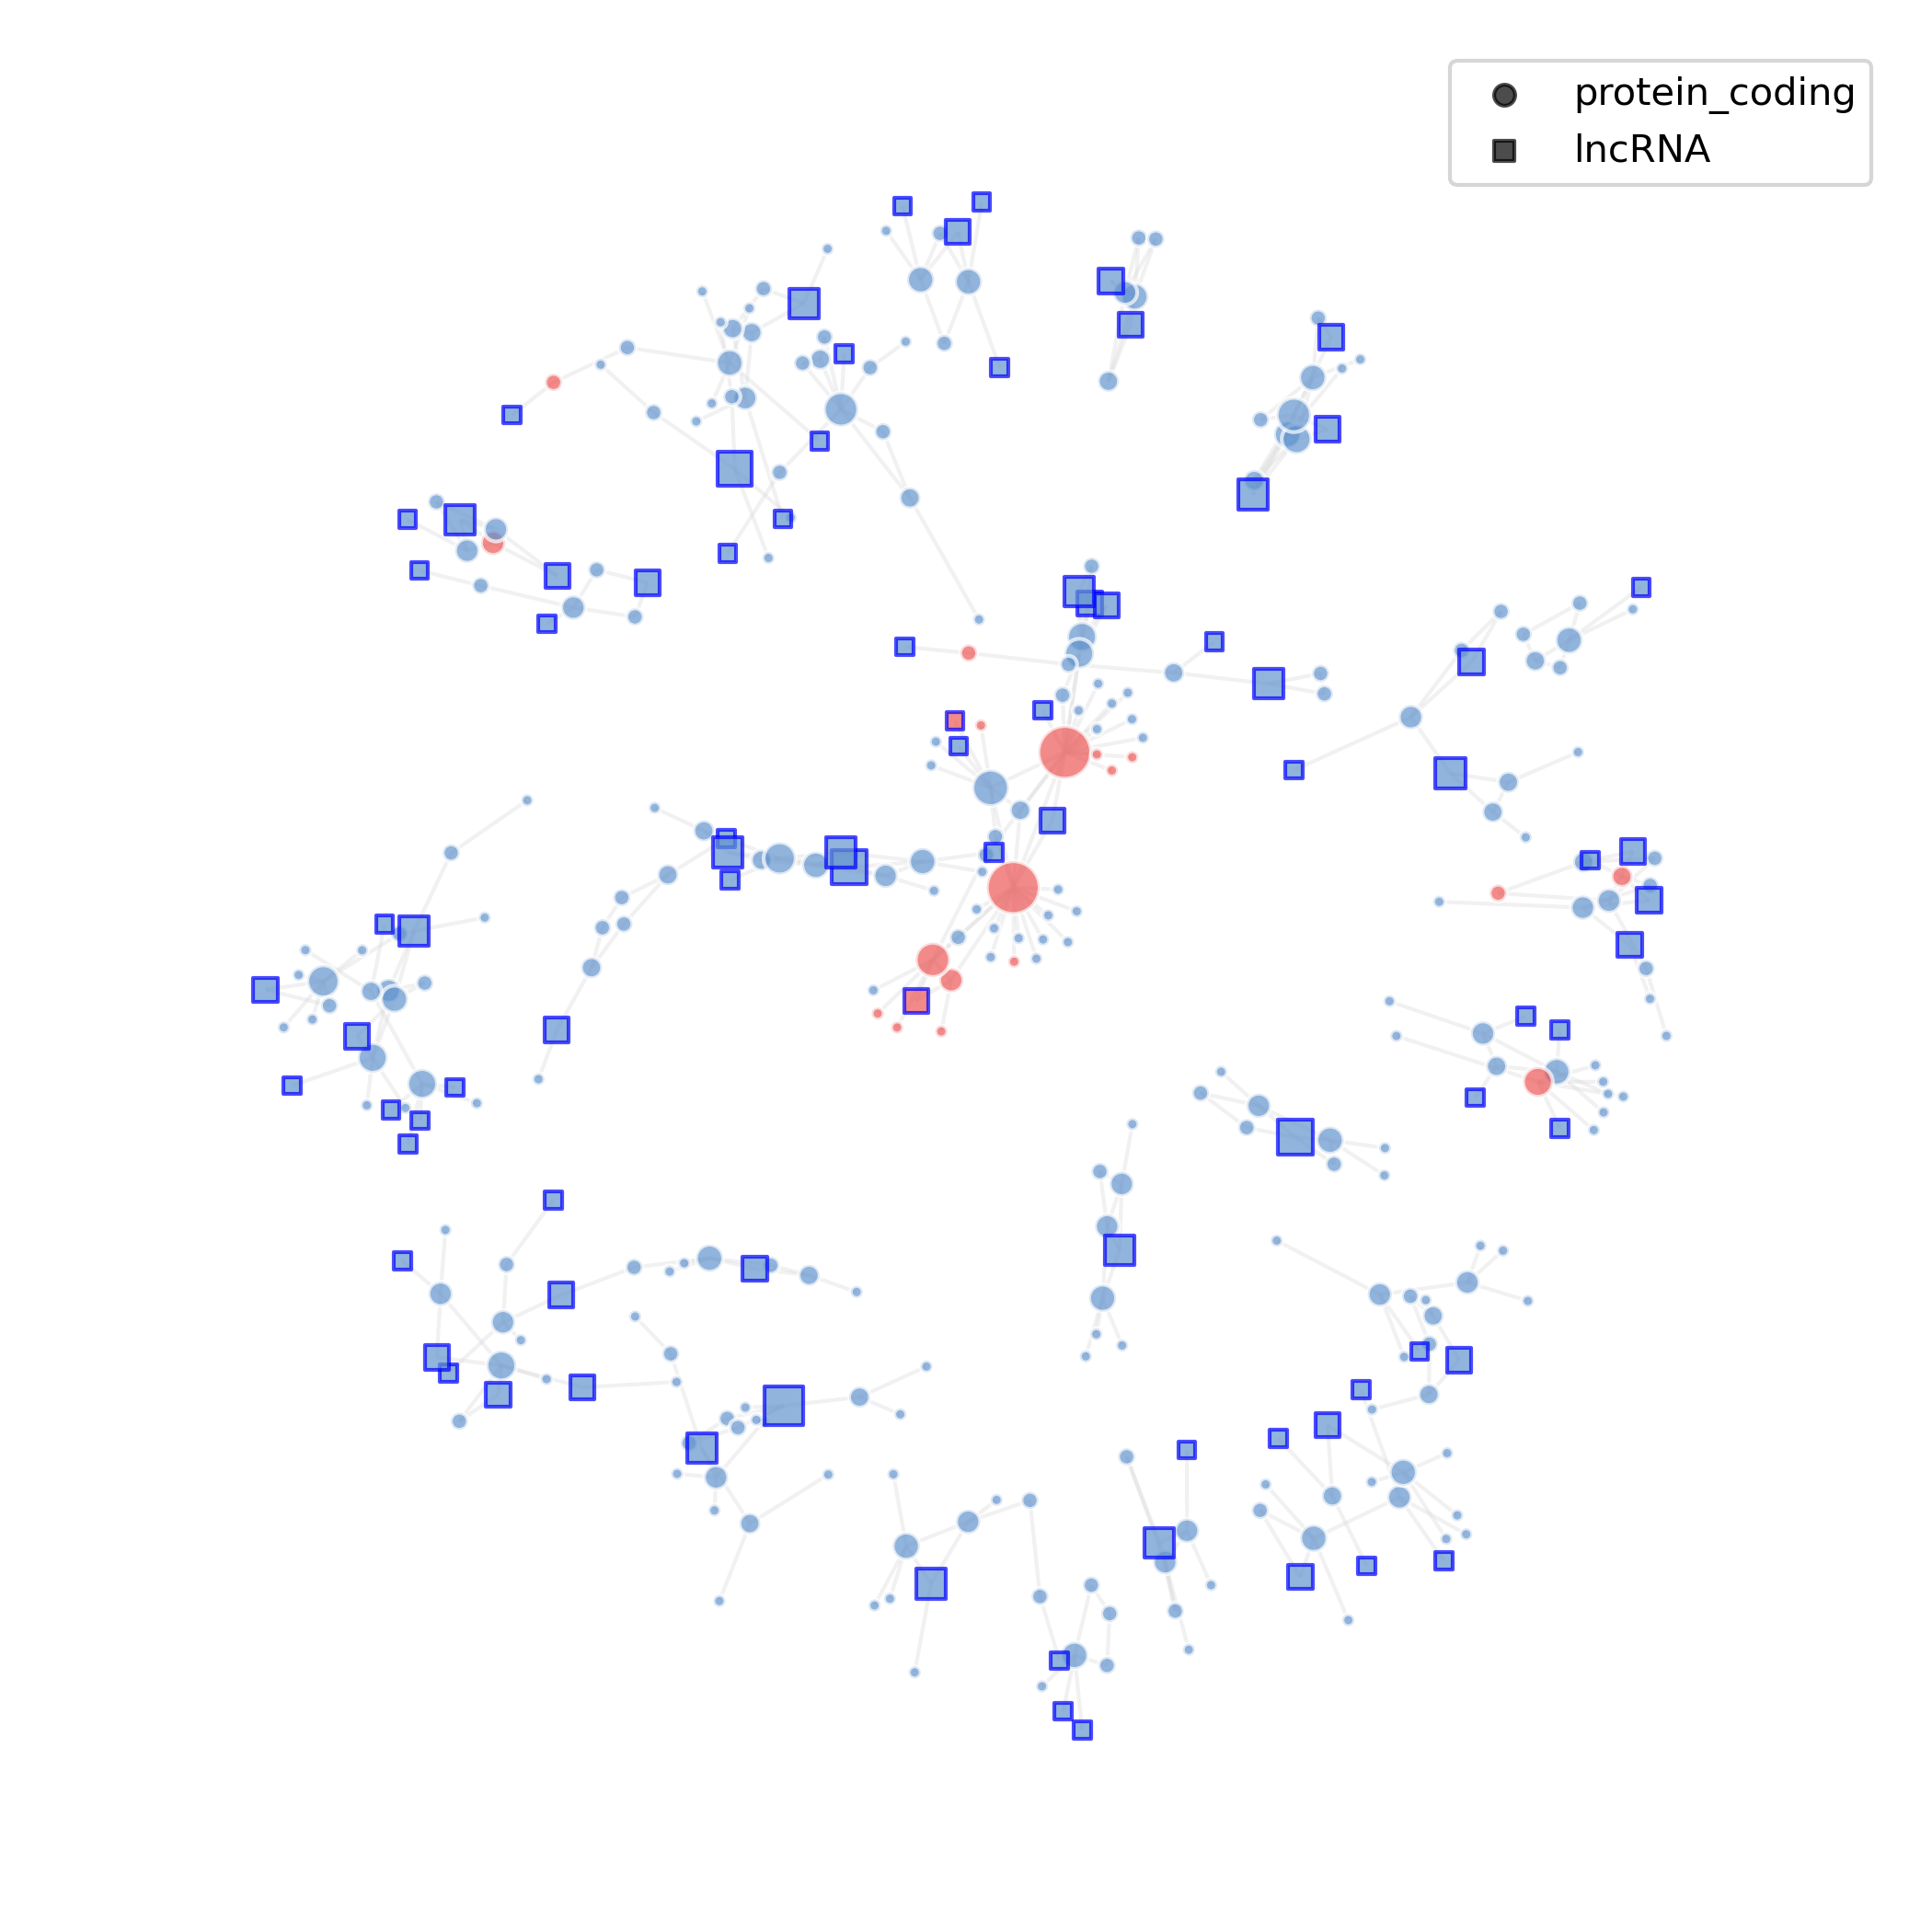
- Chart Interpretation: Squares represent lncRNAs, circles represent protein-coding genes; red indicates up-regulation (avg_log2FC > 0), blue indicates down-regulation (avg_log2FC < 0).
- Analysis Points: Observe central nodes and key lncRNAs in the network, as well as their connected functional gene groups; further combine node degree/betweenness centrality to identify "hub" or "bridge" lncRNAs as priority validation targets.
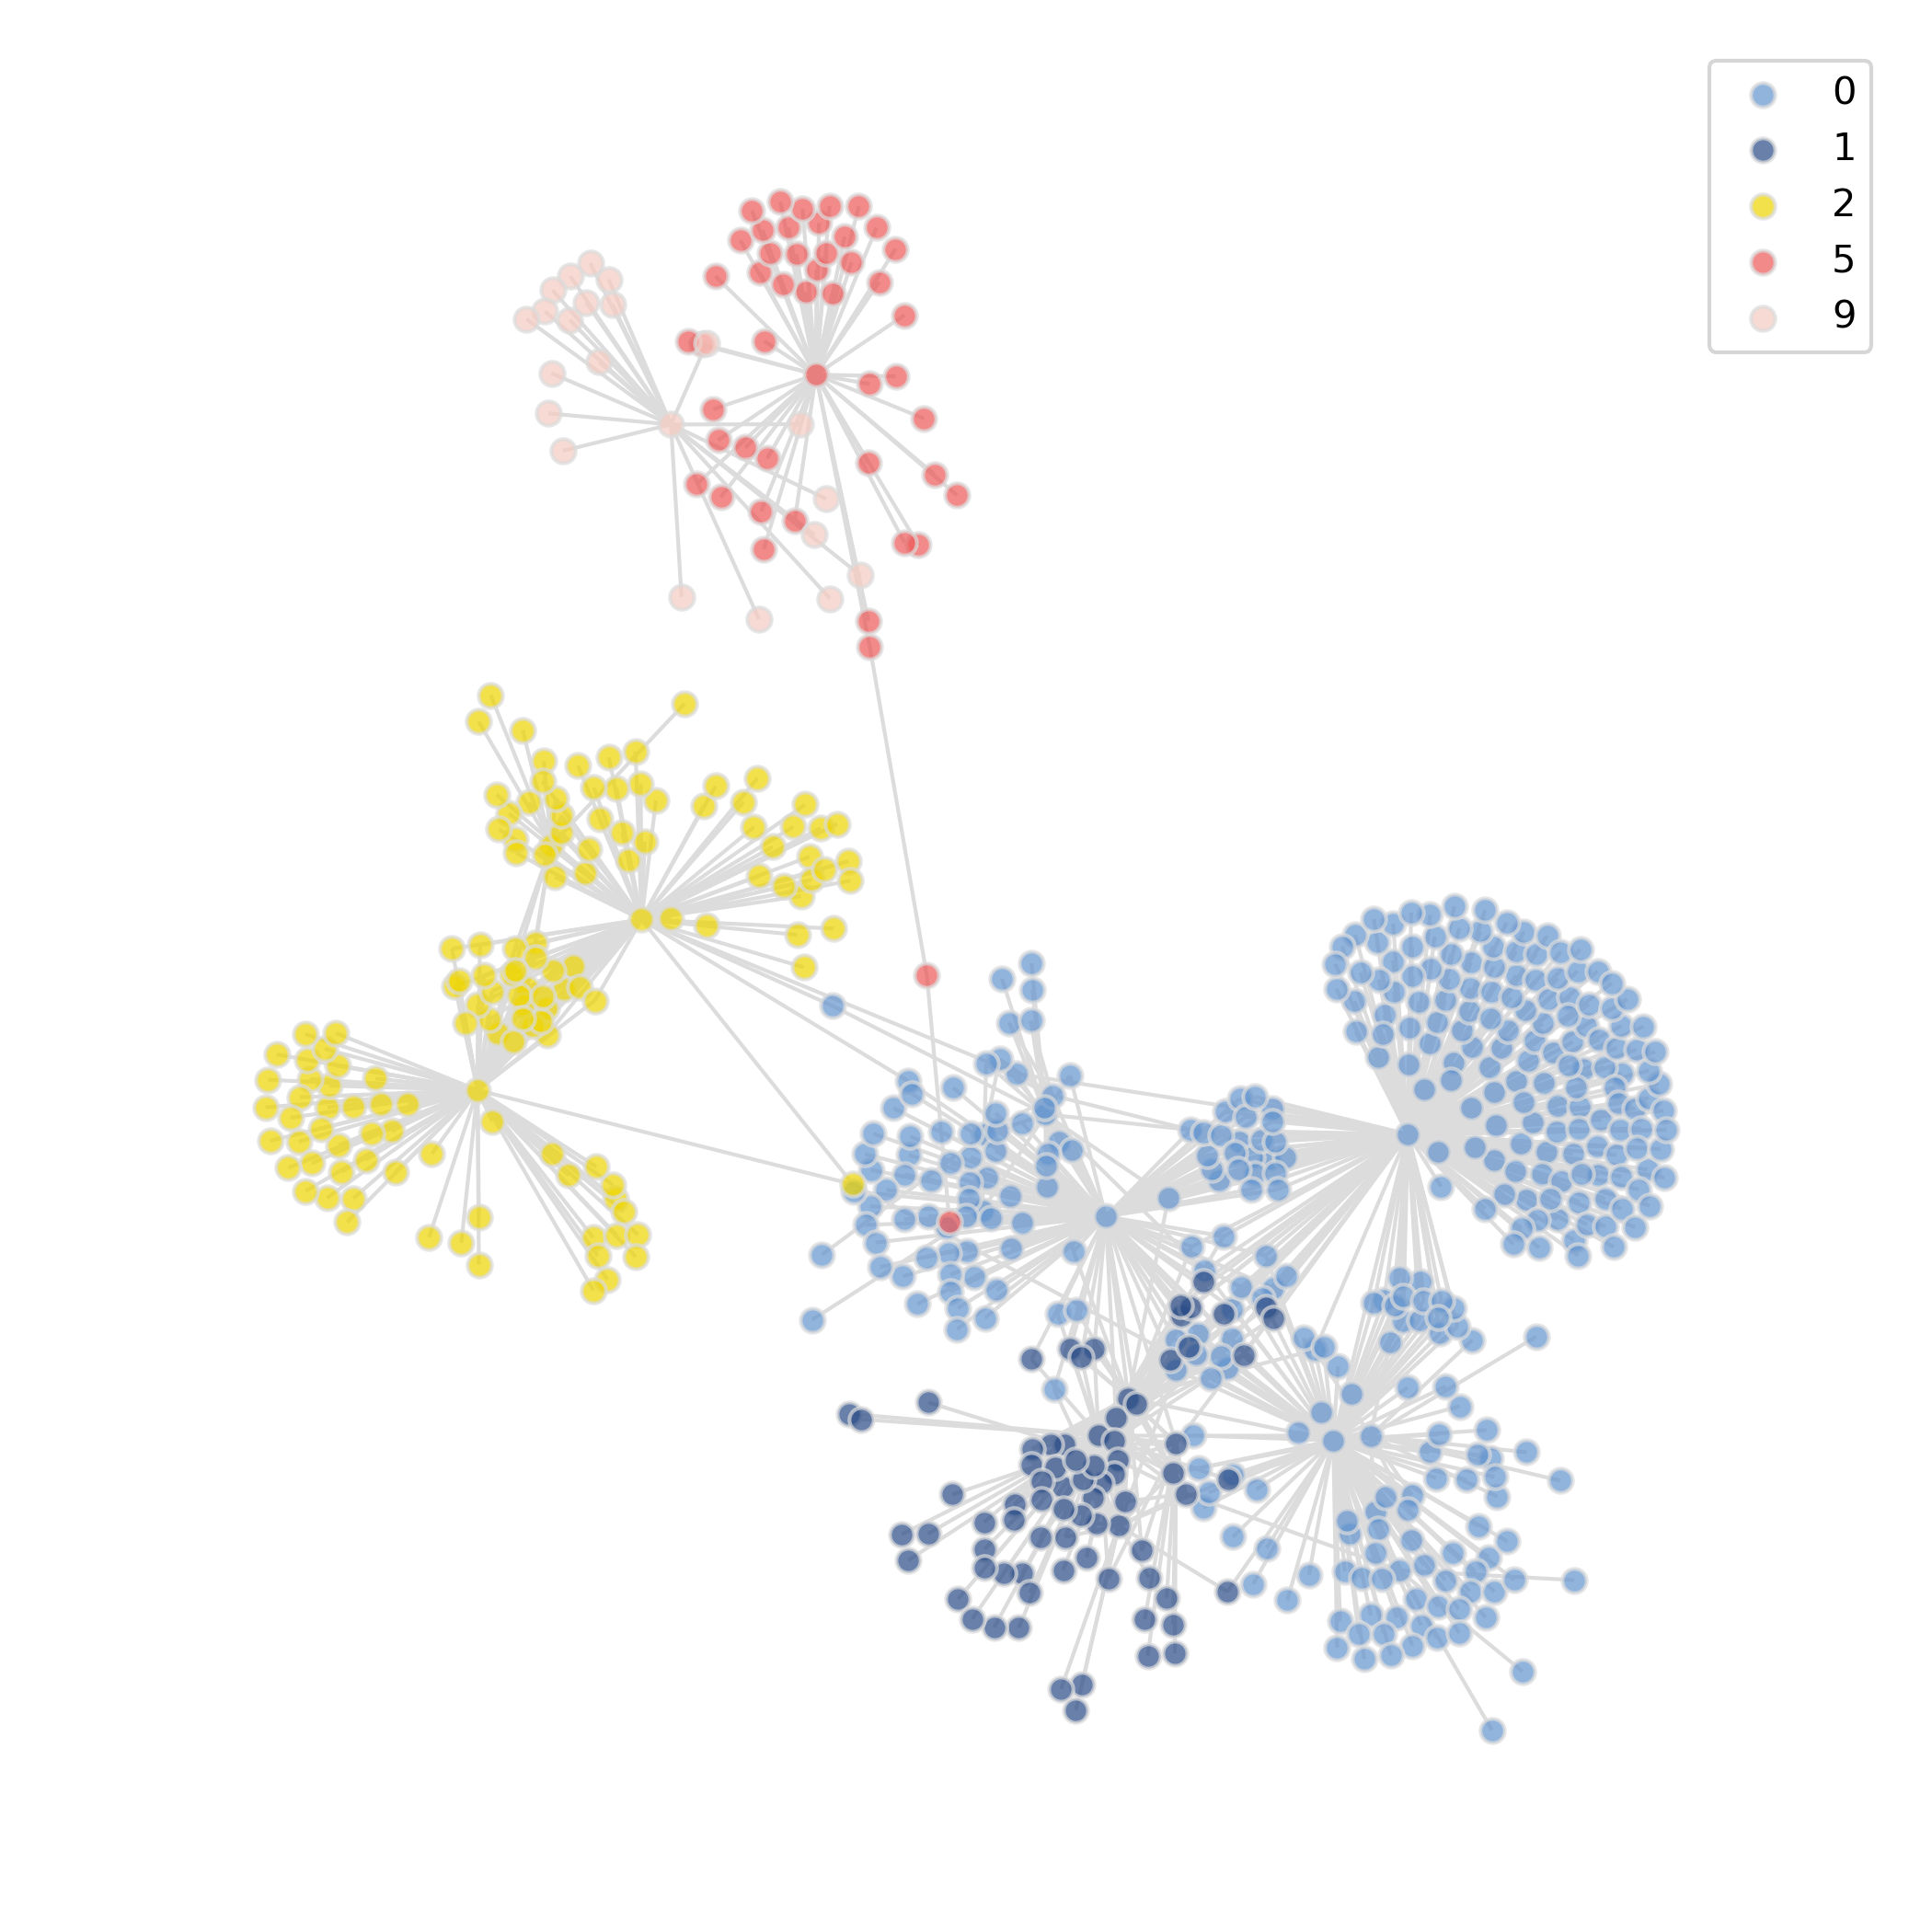
5.3.2 Module Detection
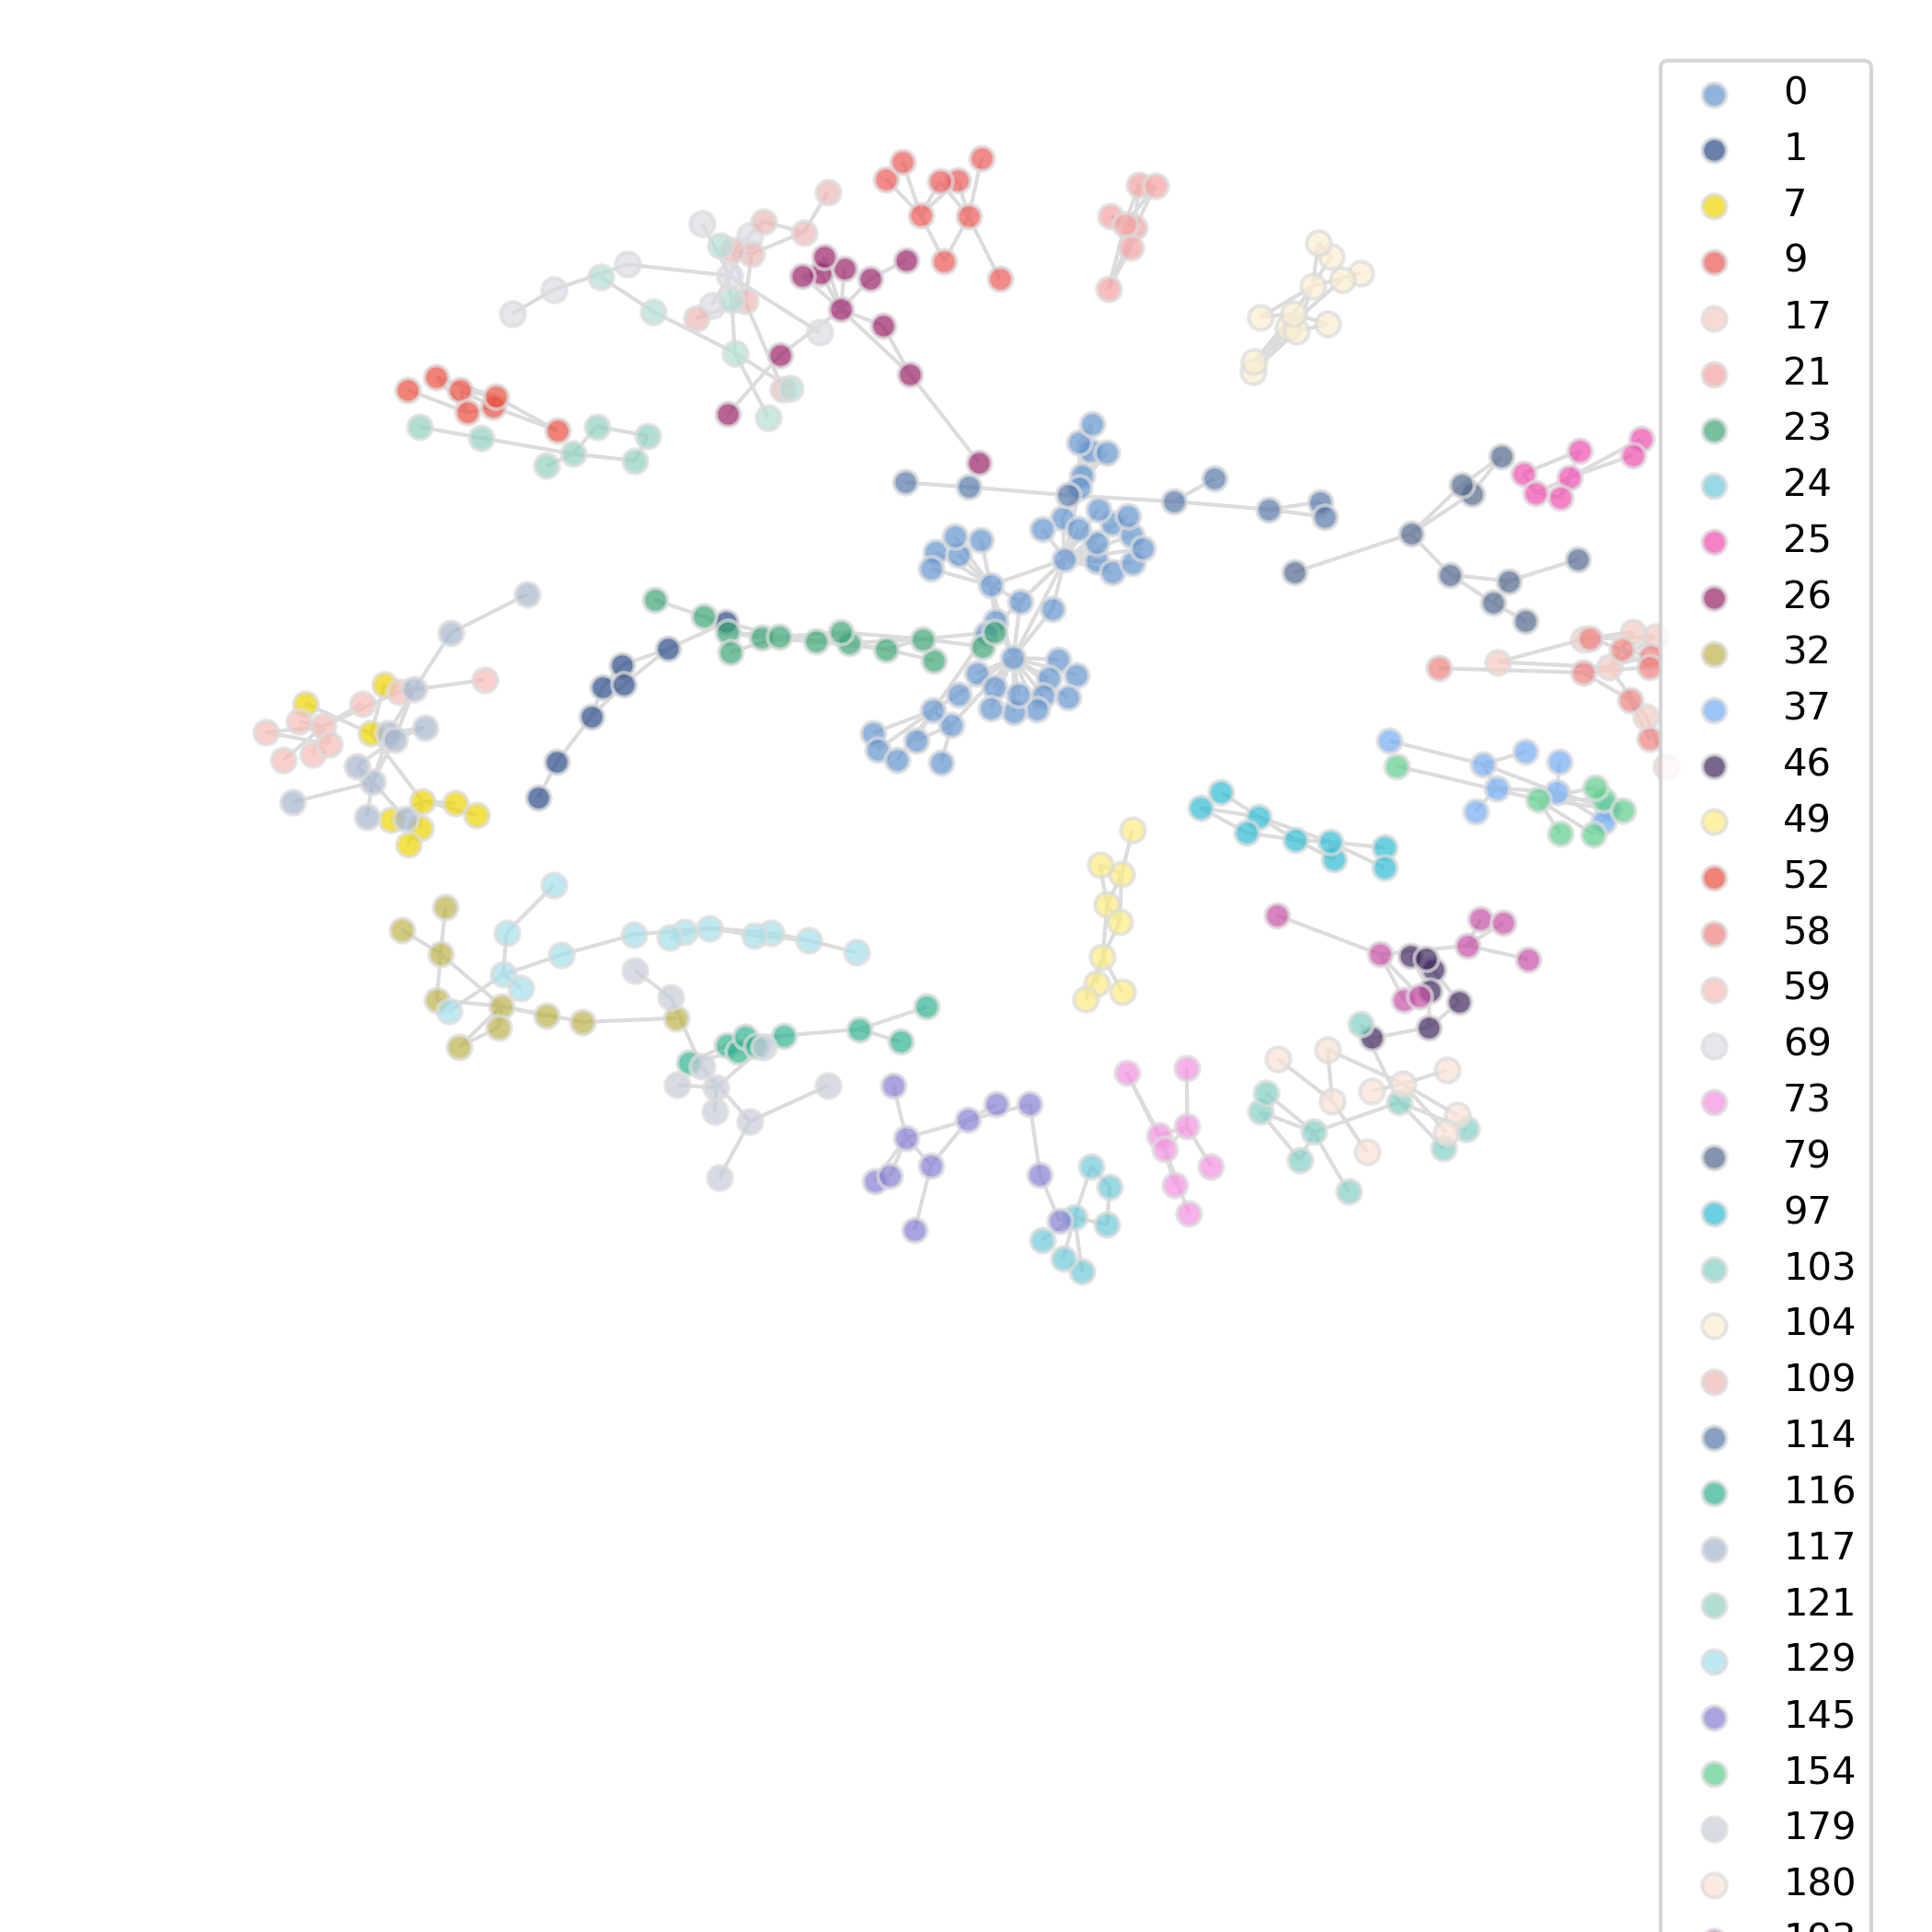
- Chart Interpretation: Different colors represent different communities (modules); numbers in the top-right legend are module IDs.
- Analysis Points: The Louvain algorithm is used for co-expression module detection, filtering out modules with degree < 7. Each module represents a gene set with highly consistent expression patterns, potentially participating in the same biological process. Modules can be double-annotated with "signature genes" and "functional pathways" to enhance the persuasiveness of biological interpretation.
5.4 Module Functional Enrichment (By Cluster)
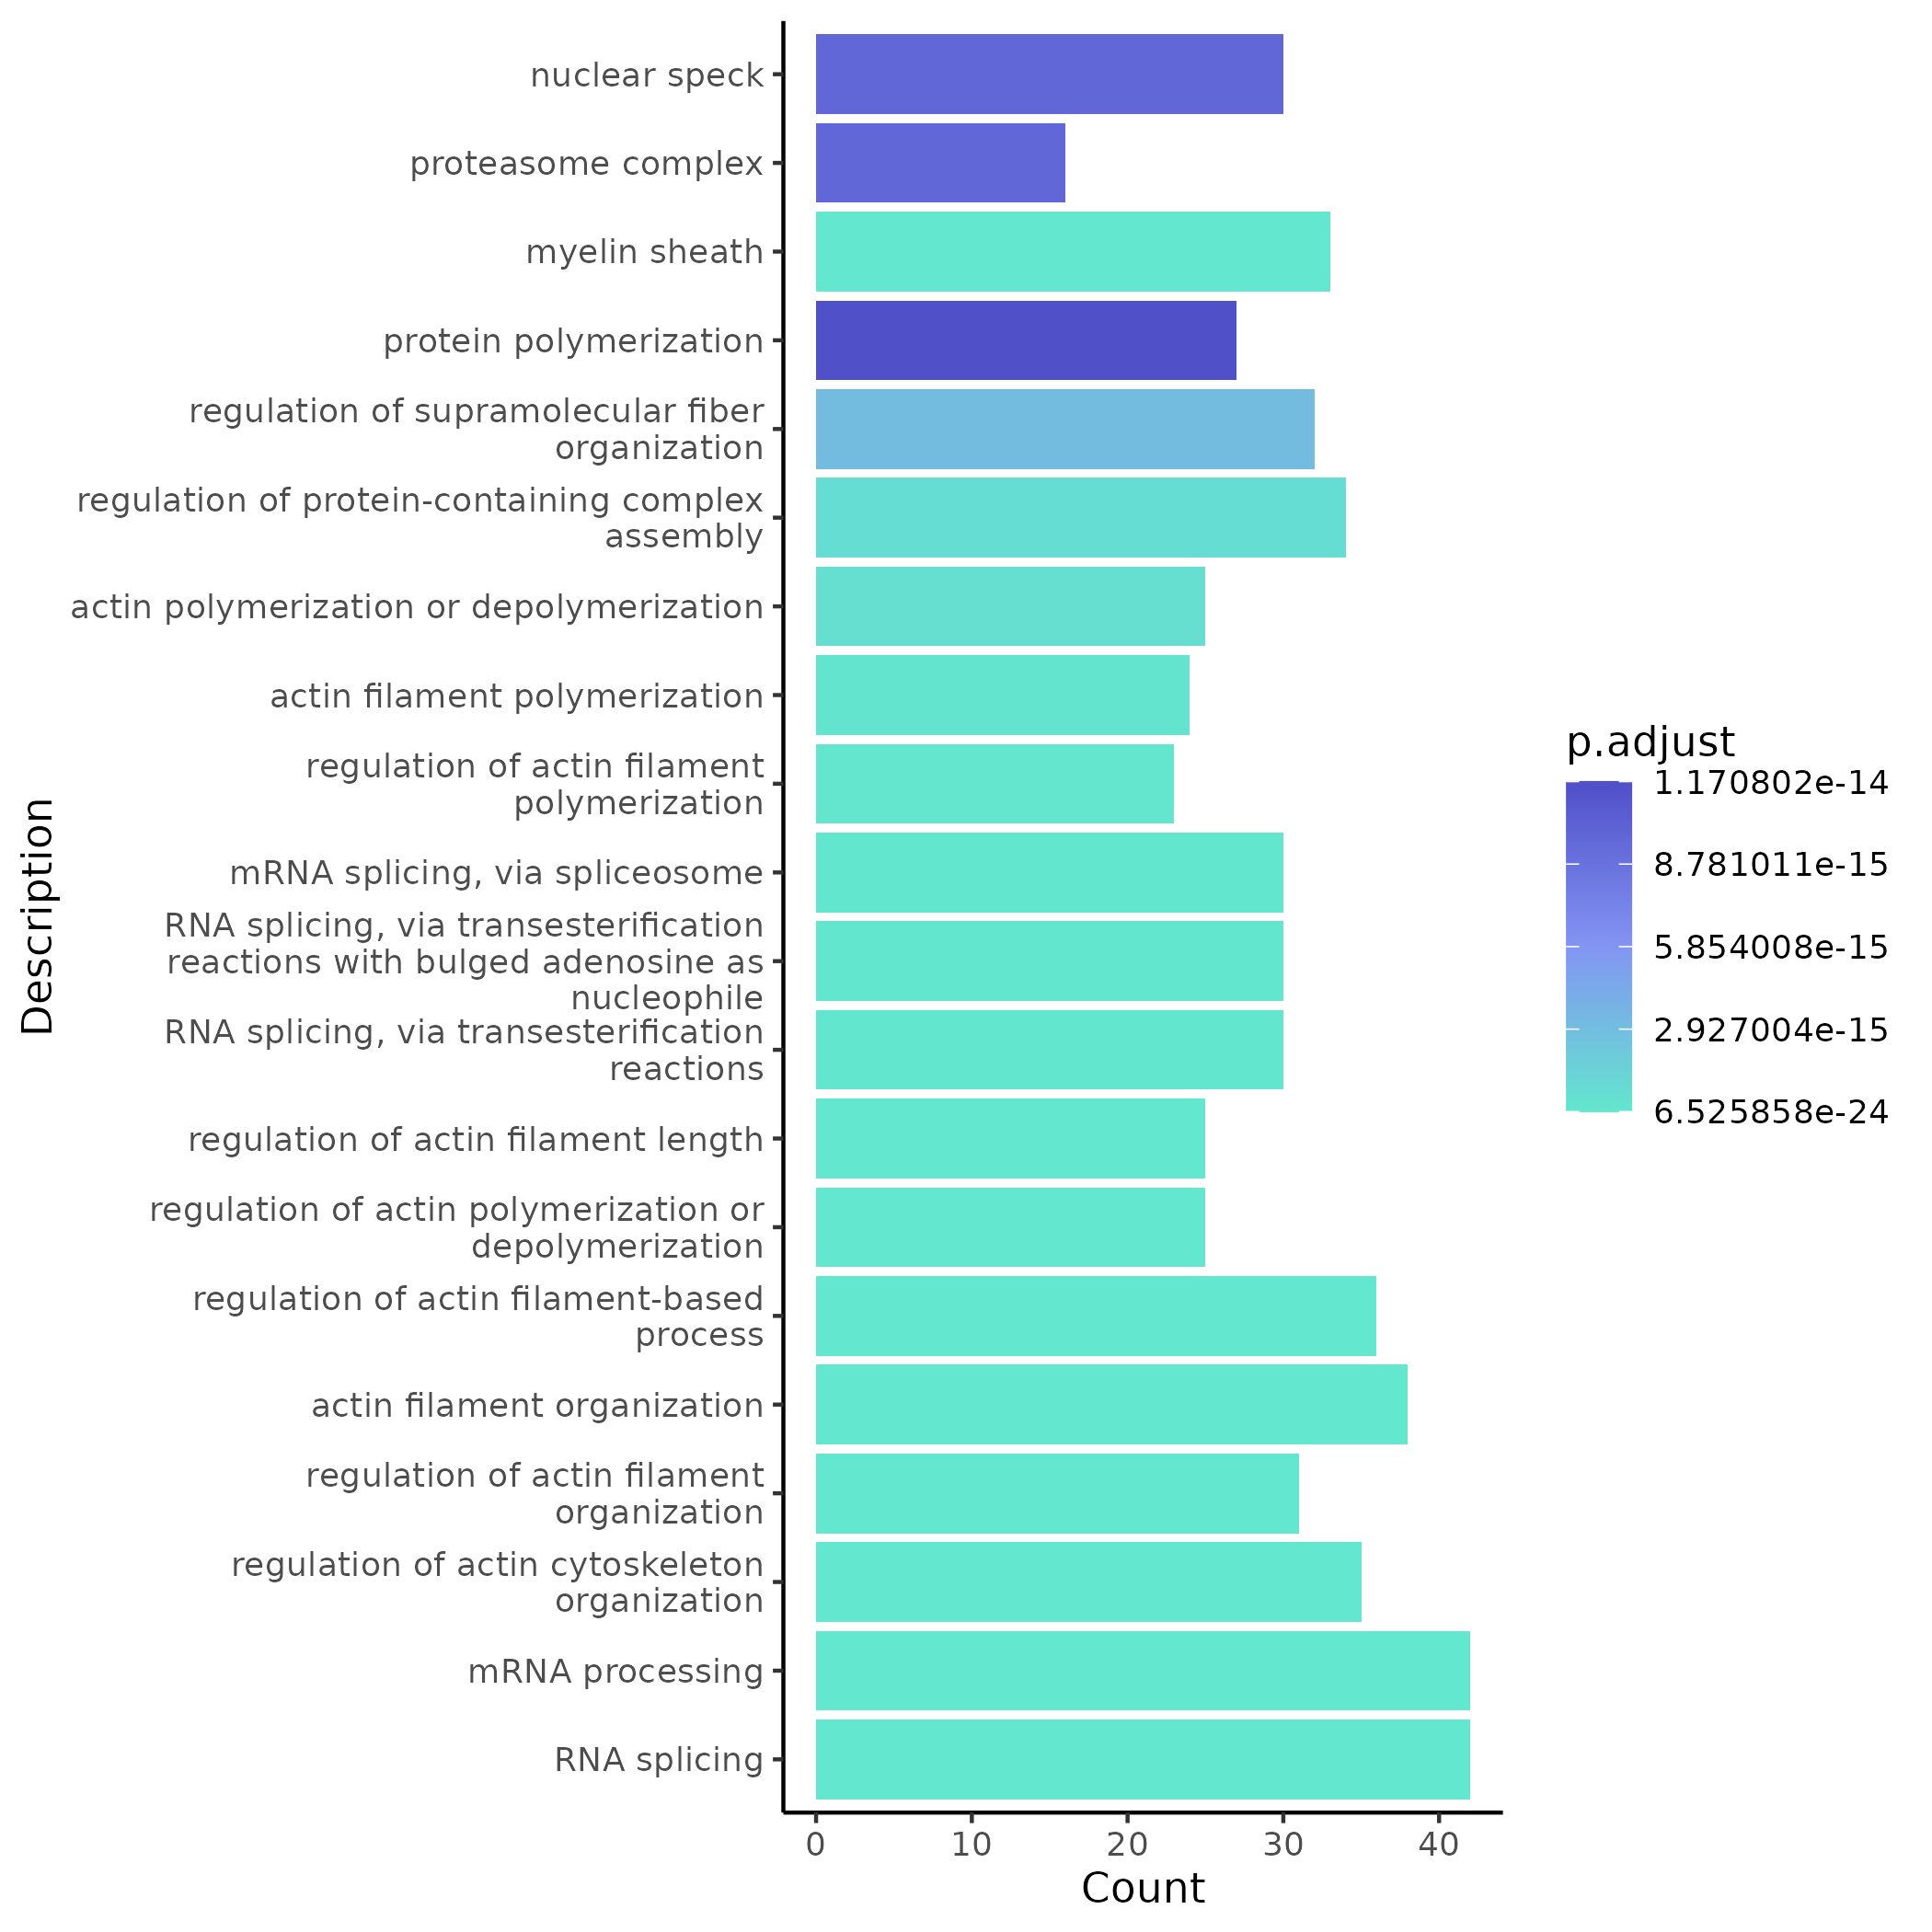
5.4.1 GO Enrichment (Example Module)
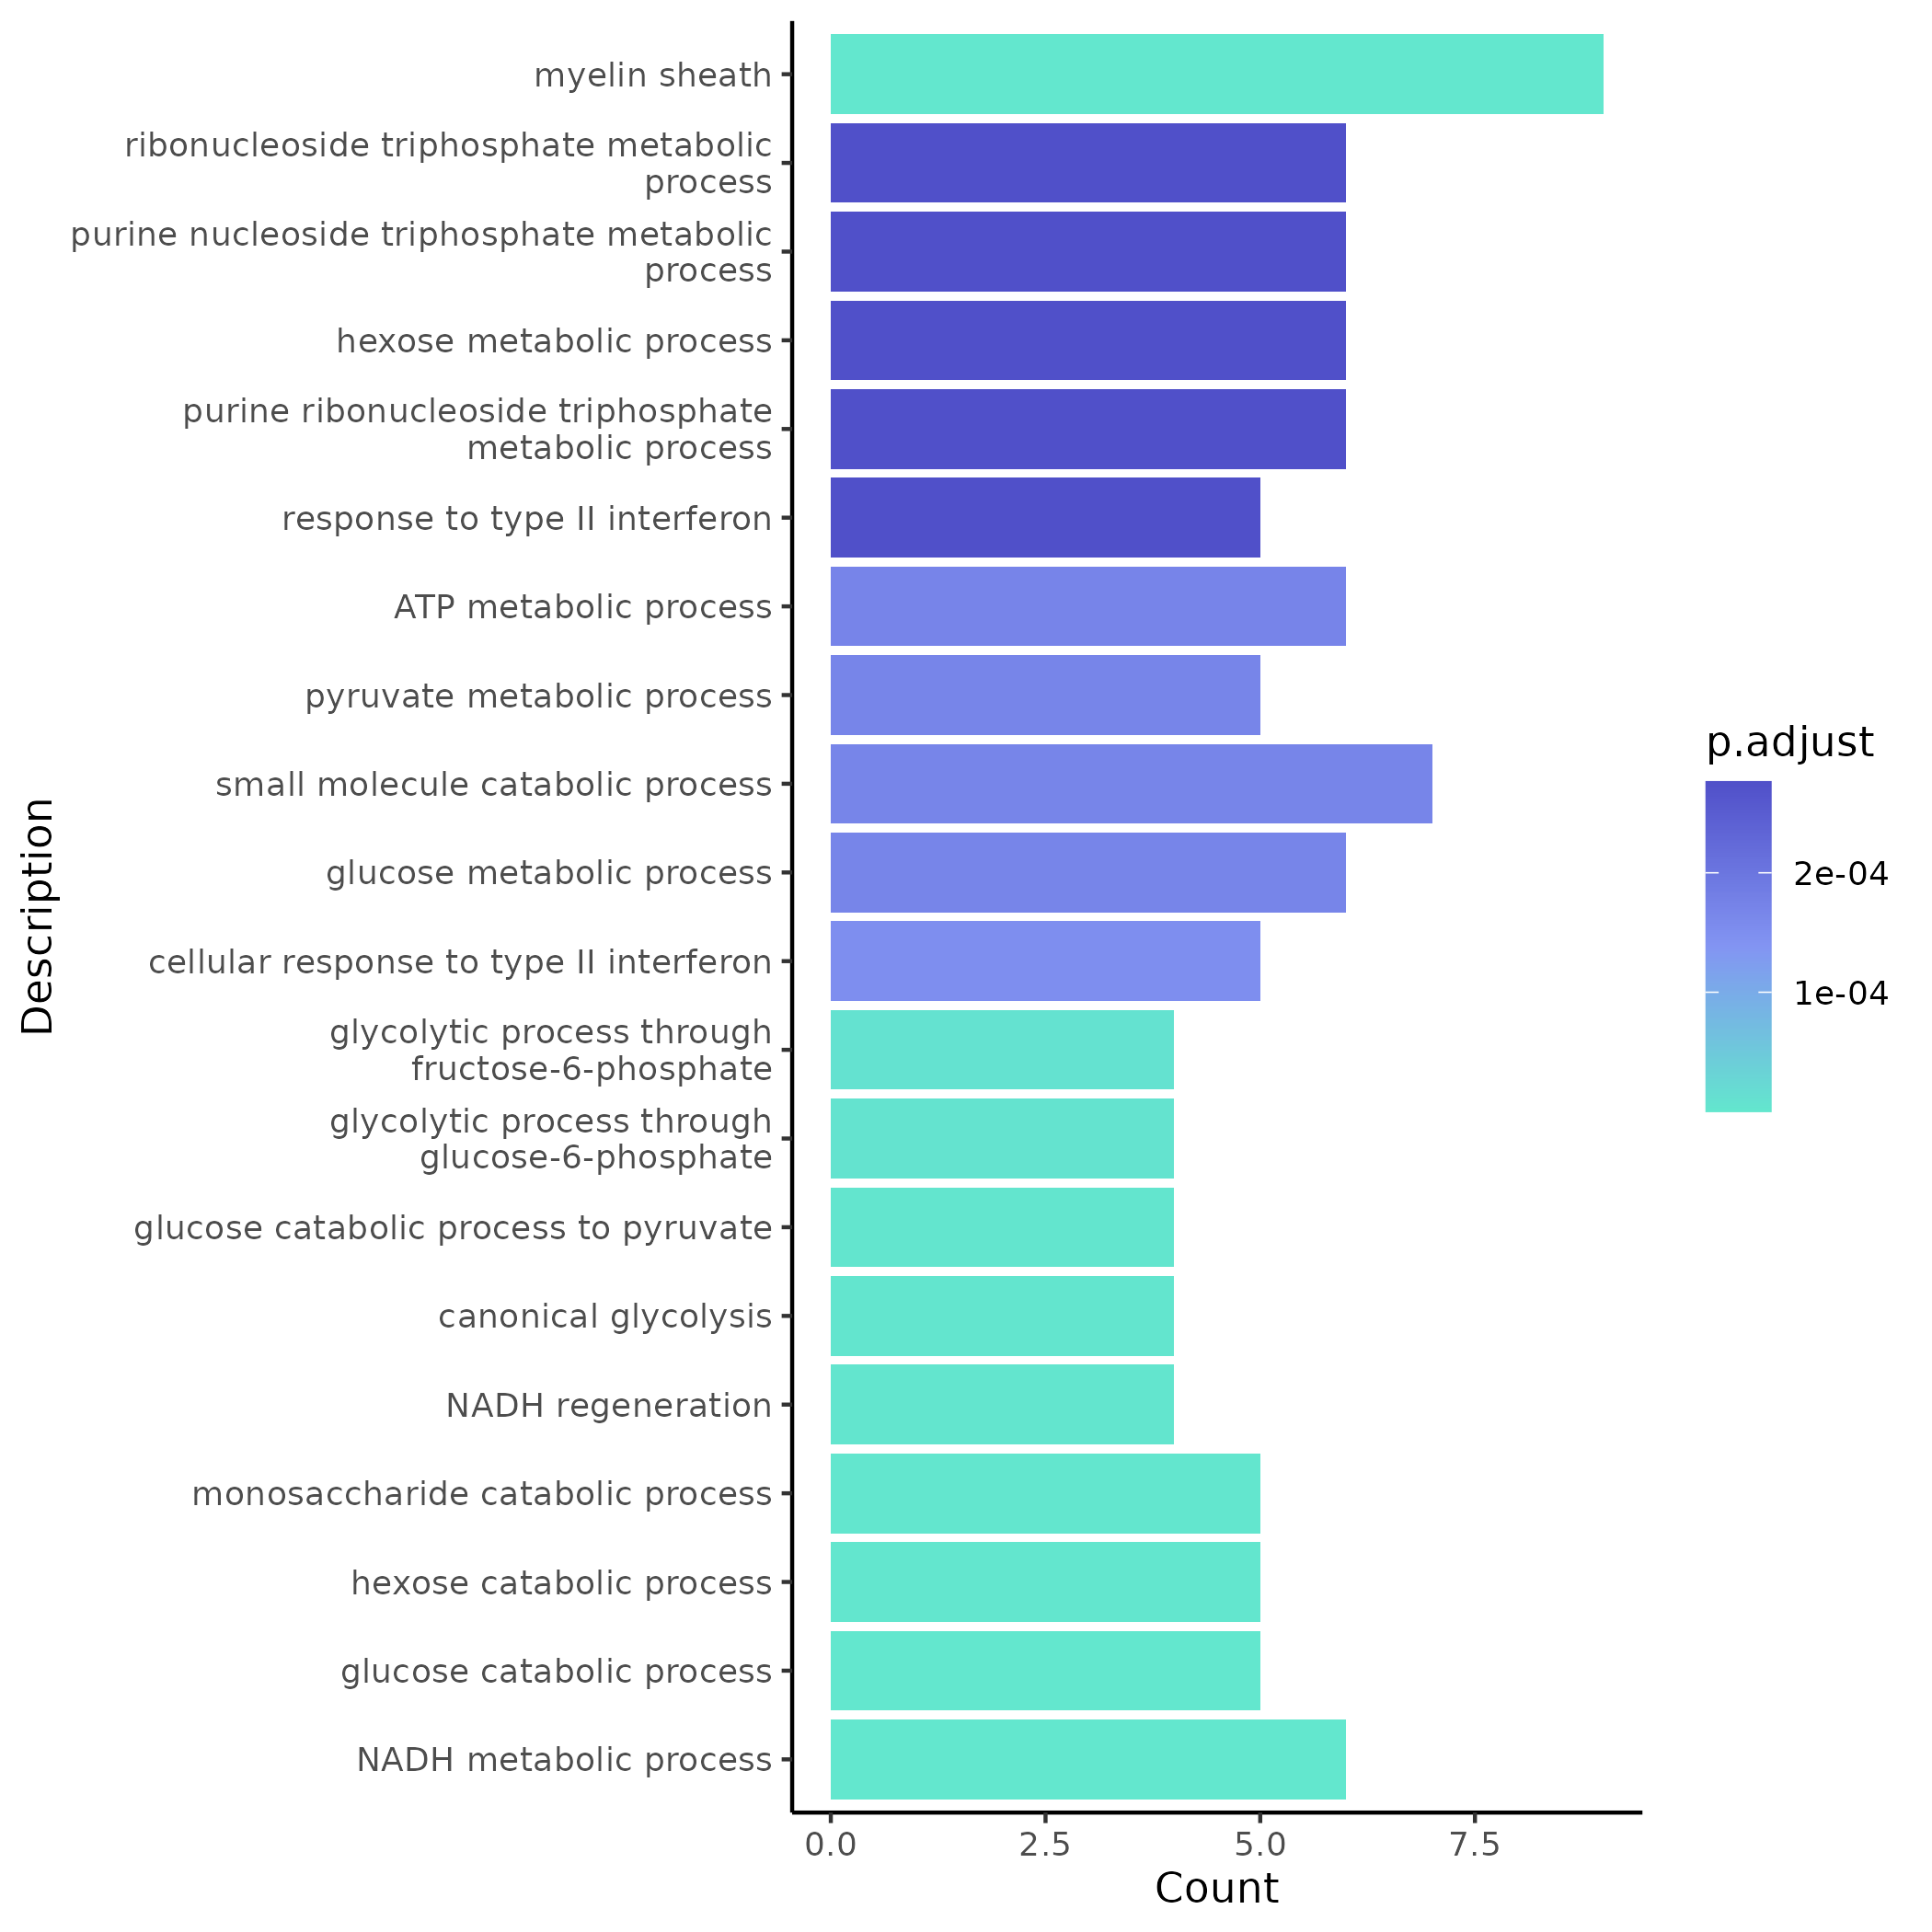
- Chart Interpretation: The x-axis shows the number of genes enriched in each term, the y-axis shows GO term descriptions; colors reflect significance (p.adjust), with lighter green indicating more significant p-values.
- Analysis Points: Prioritize GO branches (BP/CC/MF) highly relevant to the research topic, comprehensively assess based on p.adjust (significance) and GeneRatio (proportion); can trace back to the list of enriched genes to check if they include core lncRNAs and their directly adjacent co-expressed genes.
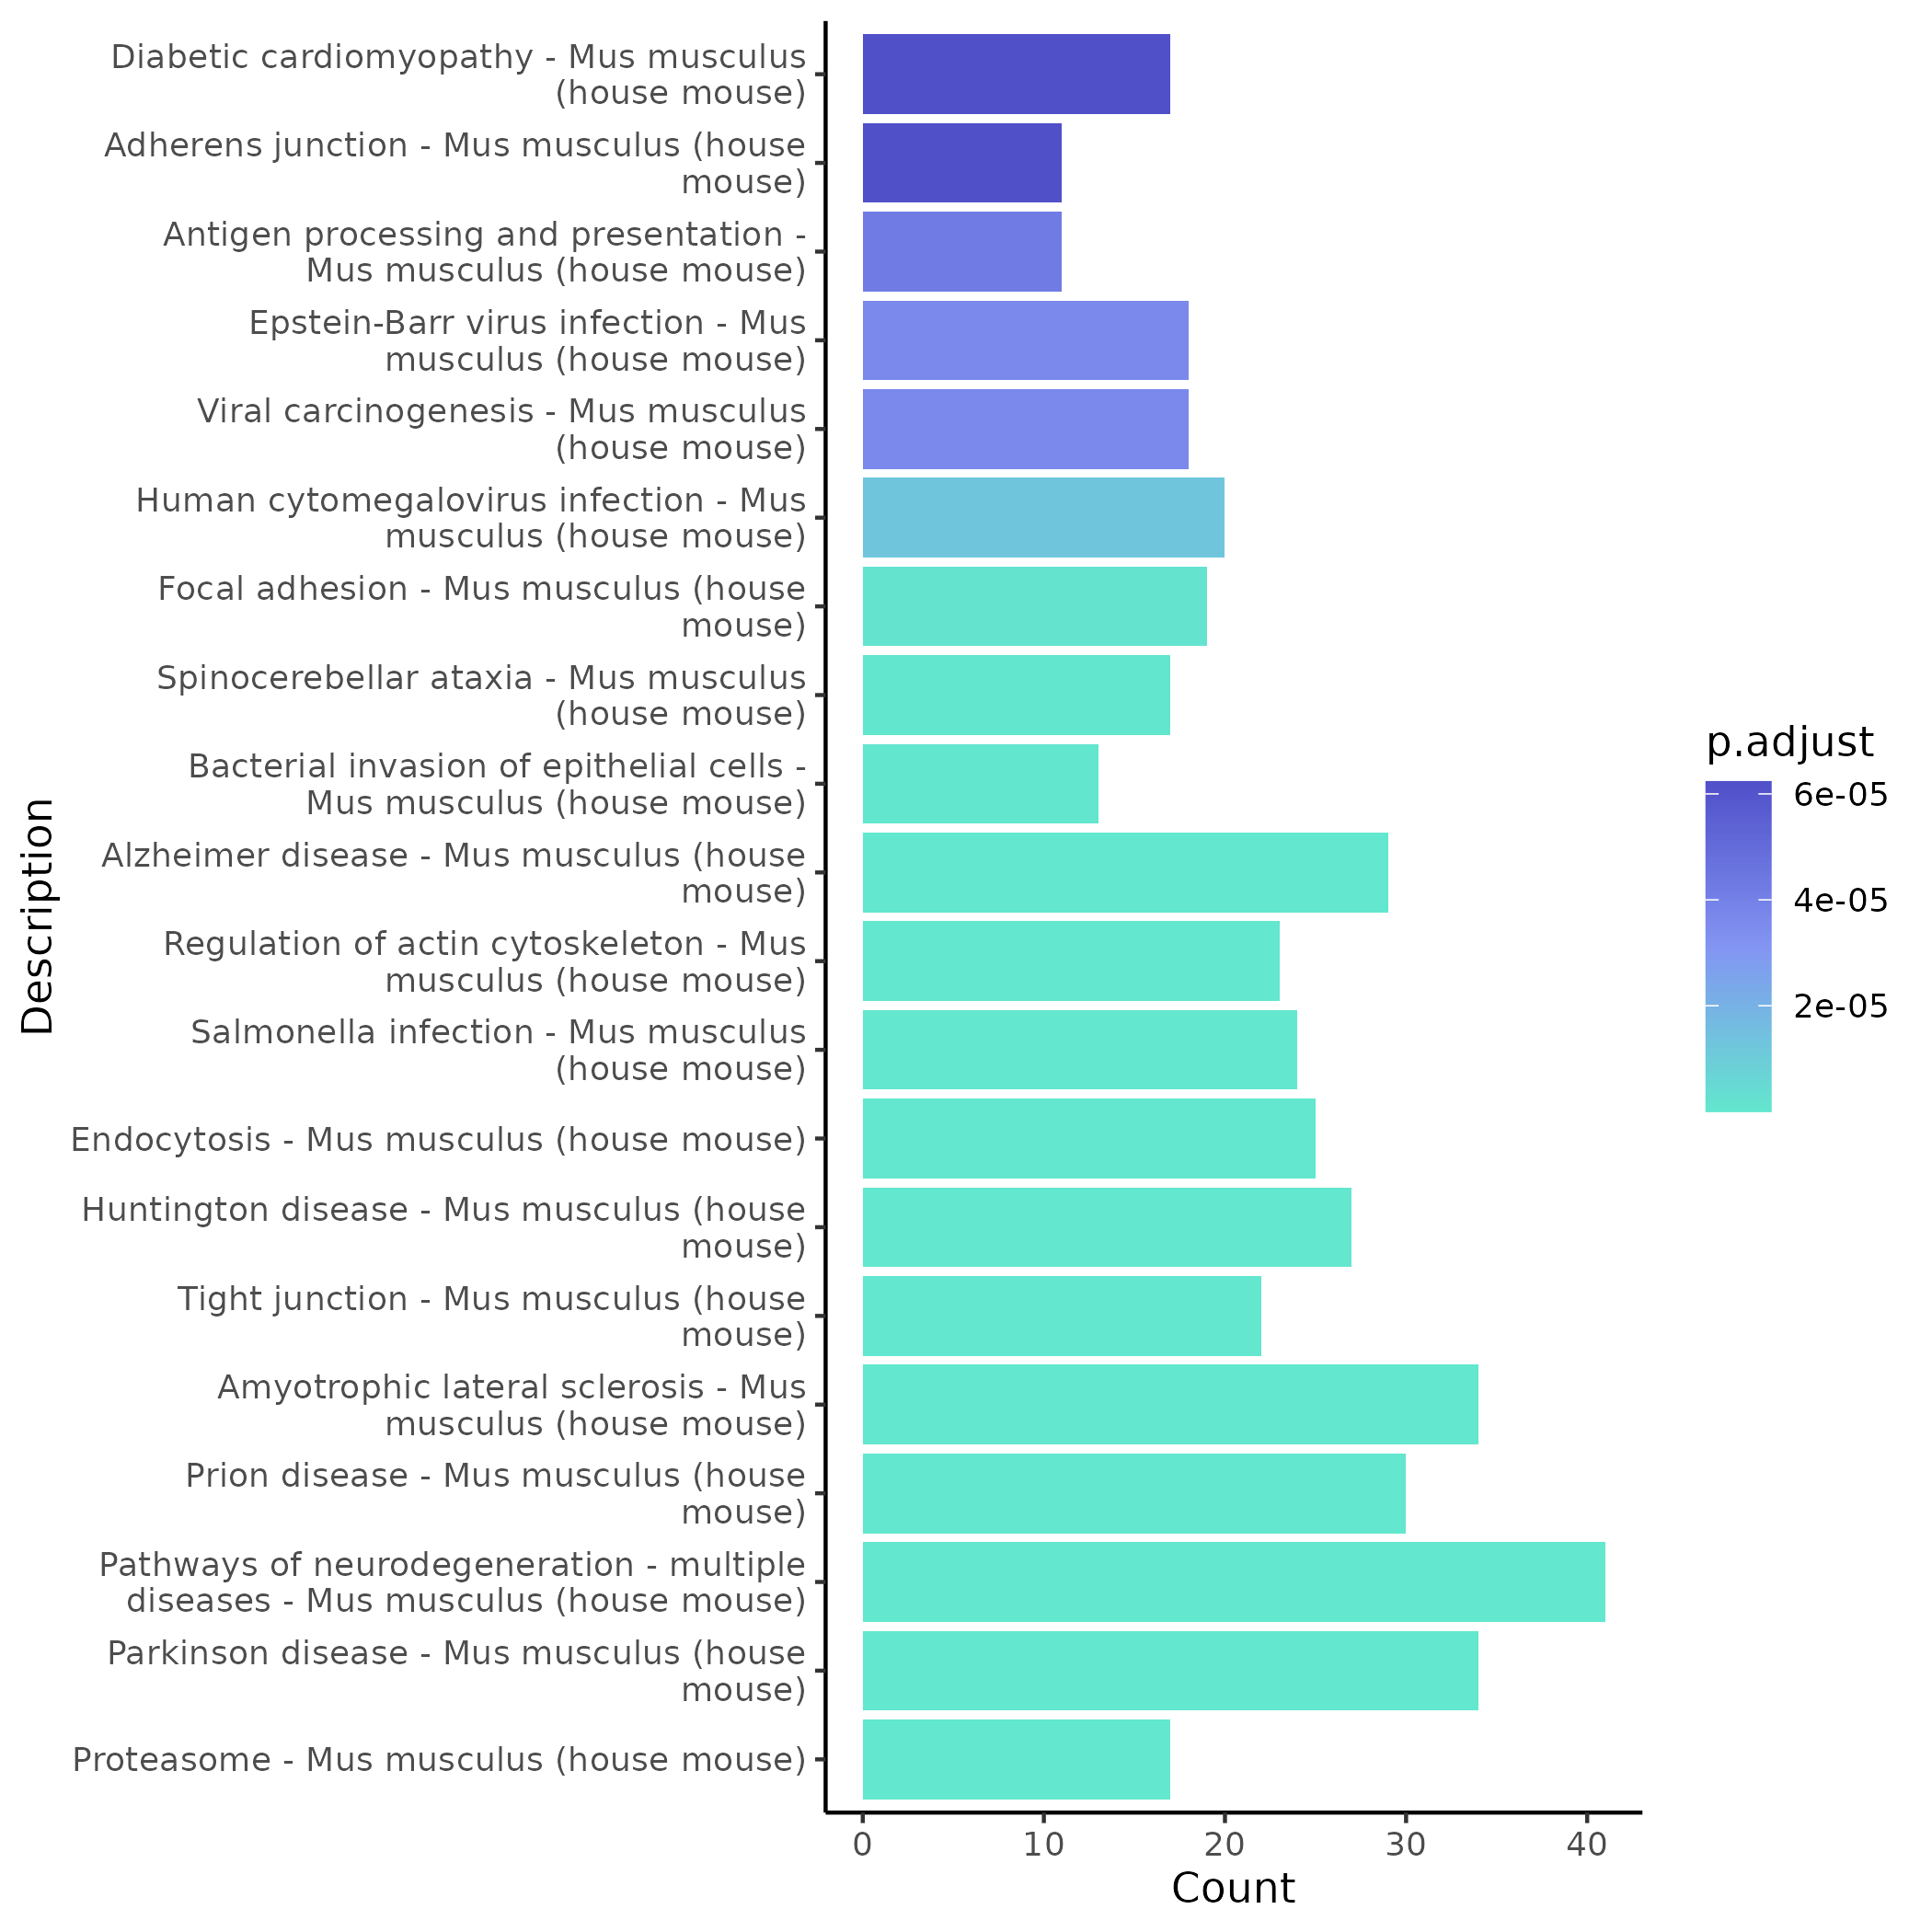
5.4.2 KEGG Enrichment (Example Module)
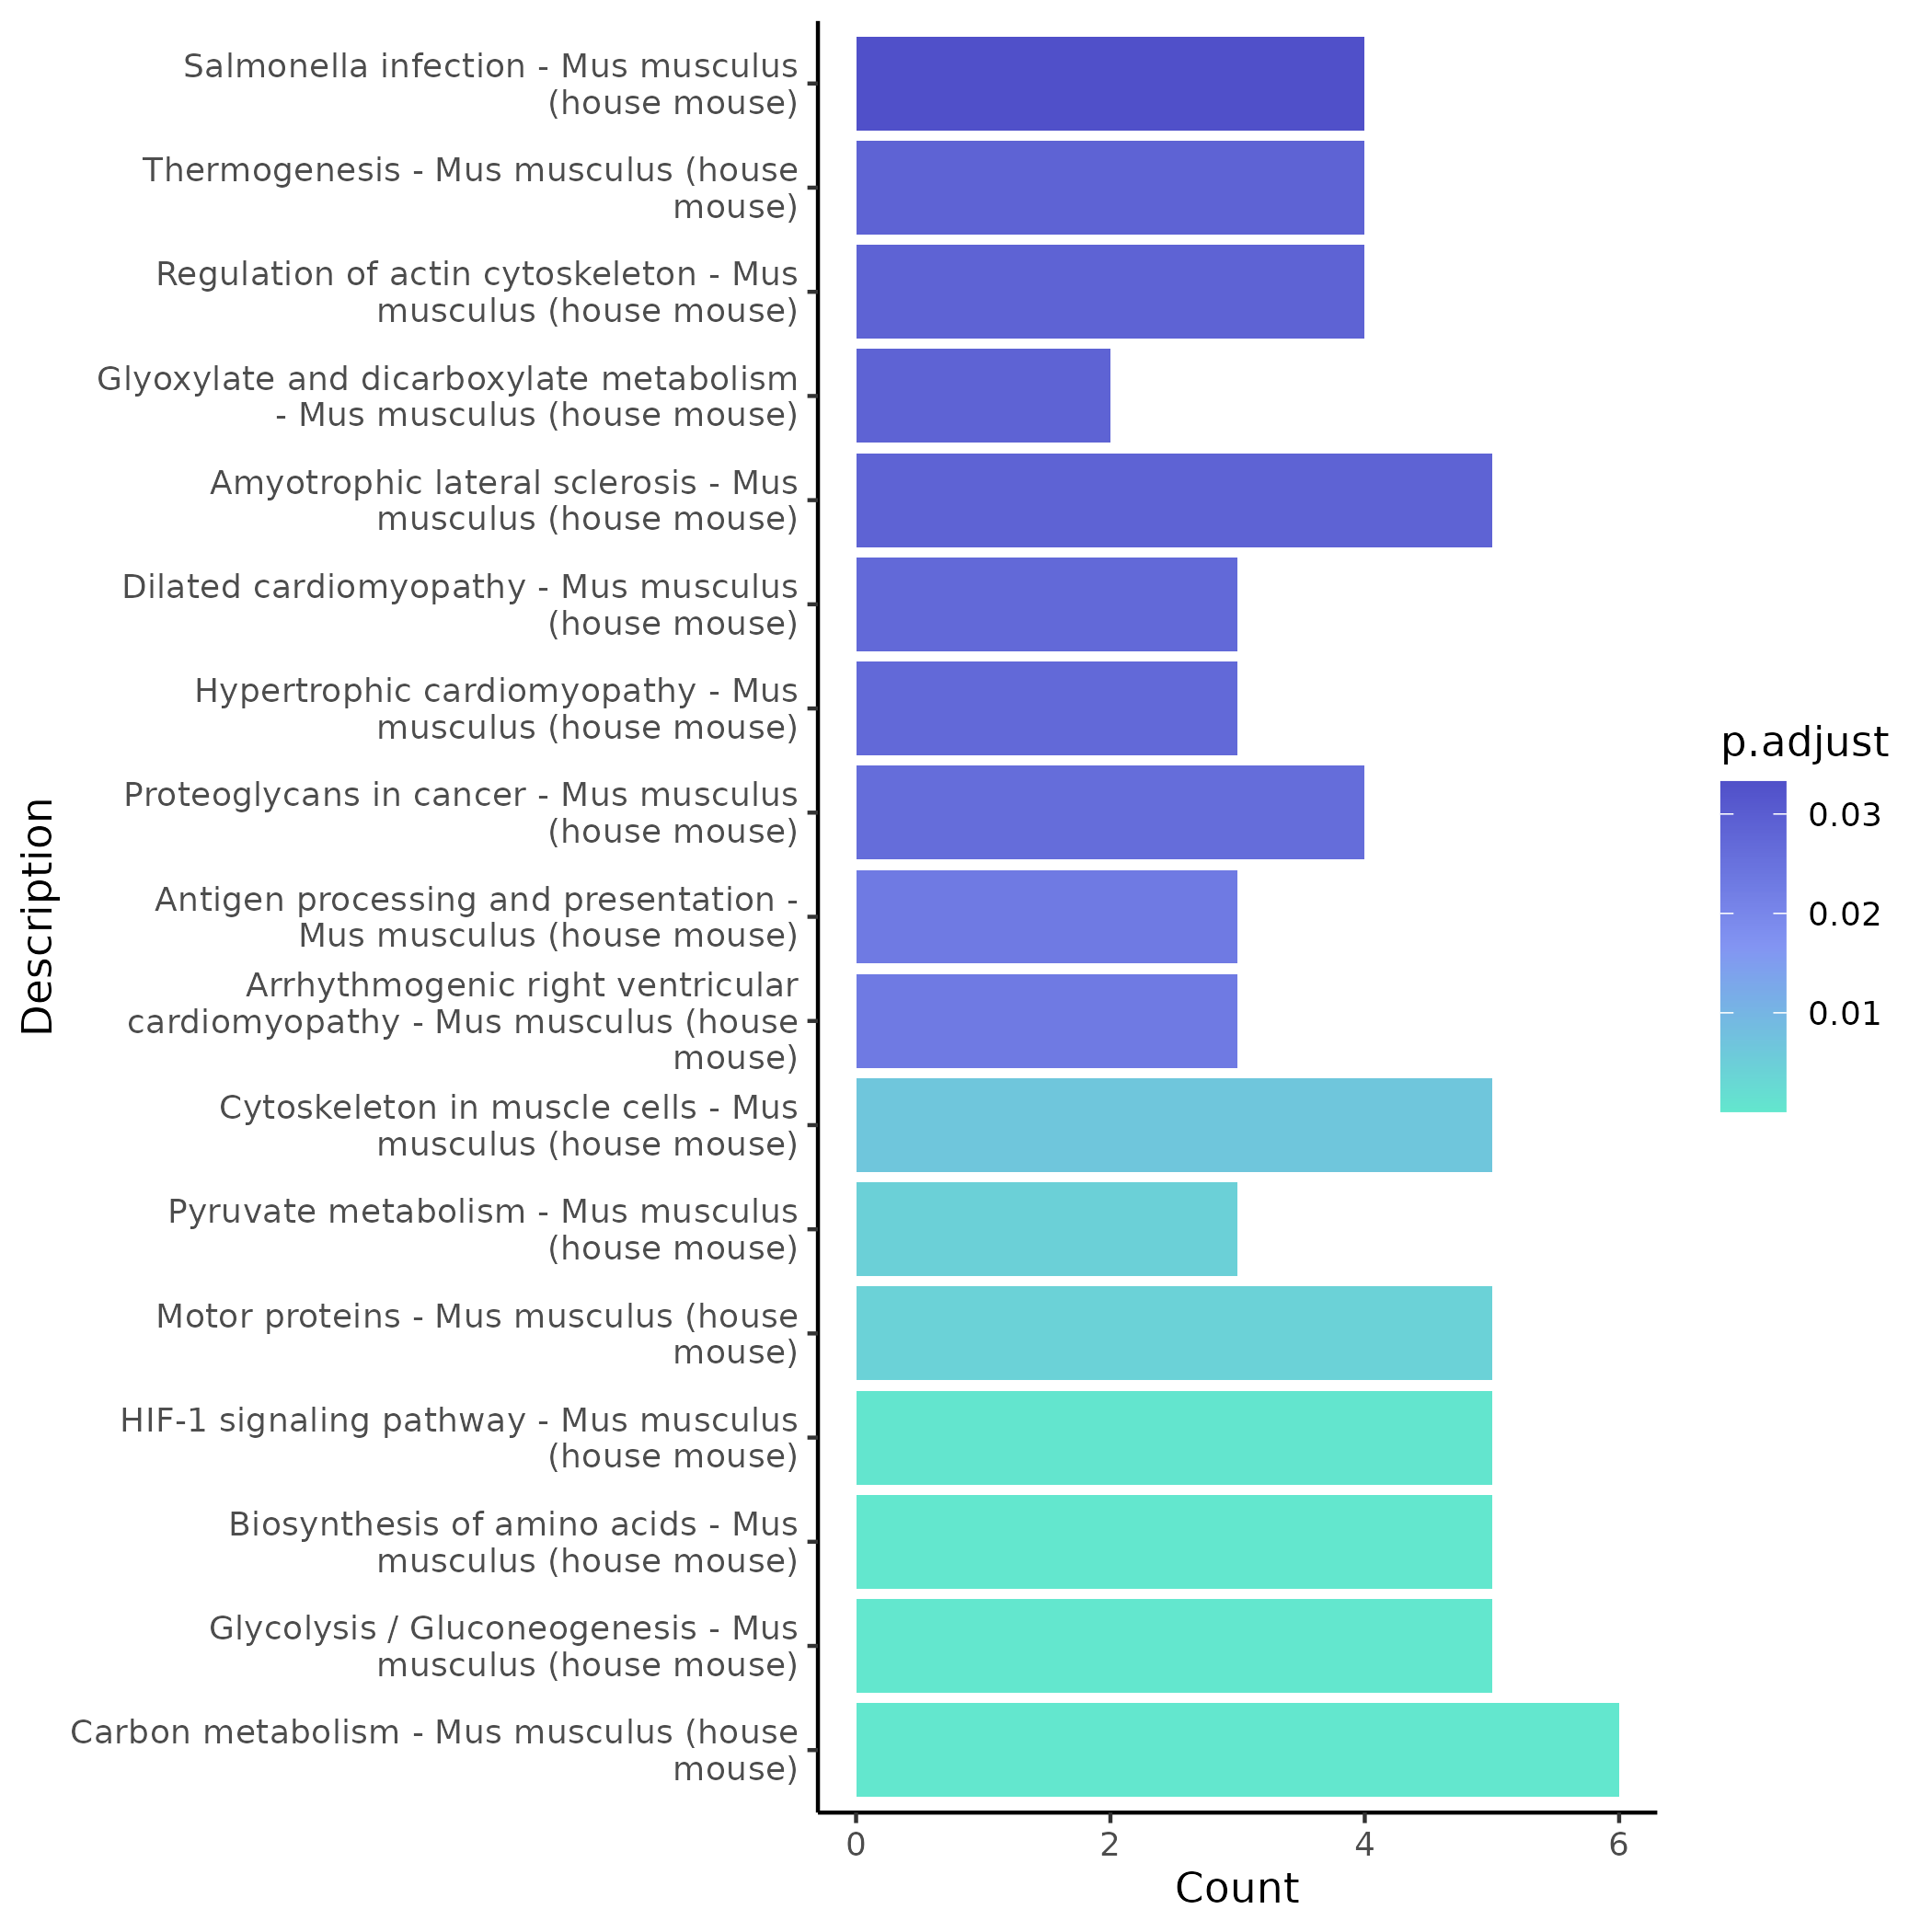
- Chart Interpretation: The x-axis shows the number of genes enriched in each pathway, the y-axis shows KEGG pathway names; colors reflect significance (p.adjust), with lighter green indicating more significant p-values.
- Analysis Points: Focus on classic signaling pathways related to the project (such as immune response, cell cycle, apoptosis, inflammation, metabolism, and tumor-related pathways); it is recommended to cross-validate with GO results and prioritize pathways that are significant in multiple databases as conclusion basis.
5.5 Group Comparison Analysis
When comparison groups are configured, differential and co-expression module analyses will be performed for both groups and their respective clusters.
5.5.1 Group UMAP Overview
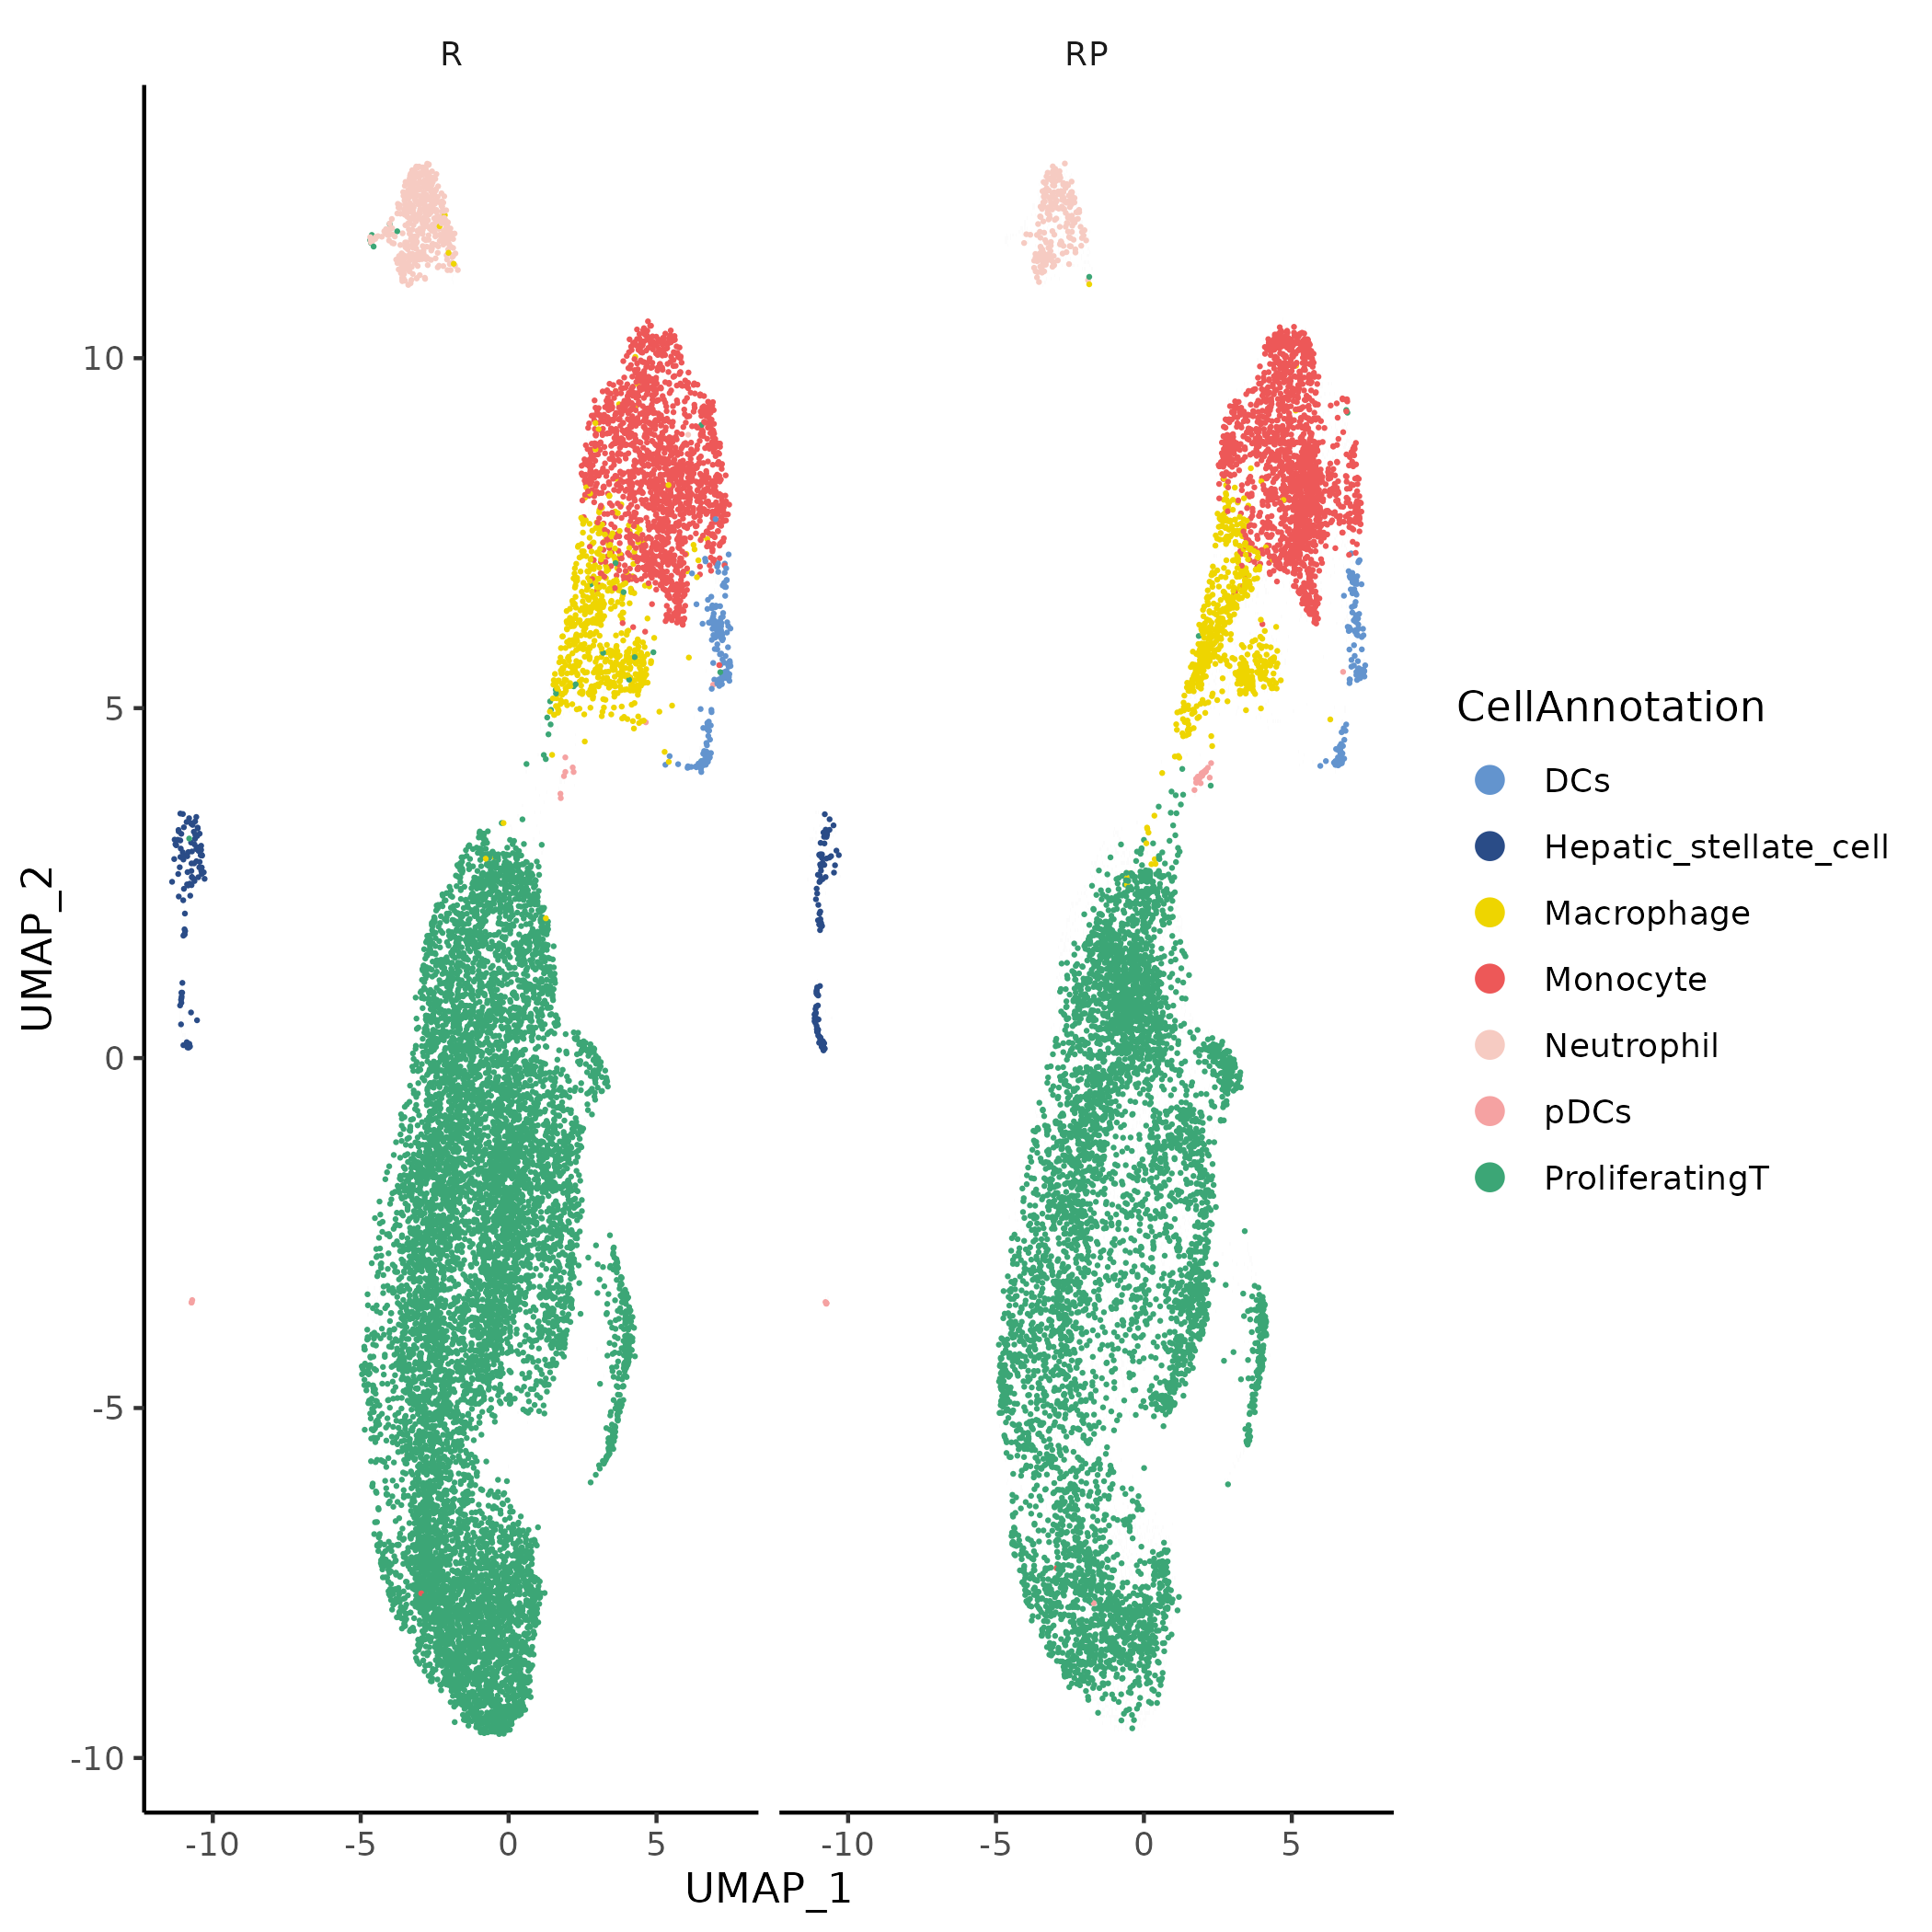
- Chart Interpretation: UMAP displayed split by sample/group (e.g.,
Sample/Group); colors in each subplot represent cell clusters/annotation labels, facilitating comparison of distribution differences between groups in the global structure. - Analysis Points: Observe changes in cell composition and spatial position between treatment and control groups, identify if there are obvious changes in cell subpopulation proportions or community rearrangement, providing background information for interpreting group differences.
5.5.2 nCount/nFeature Distribution of Each Group
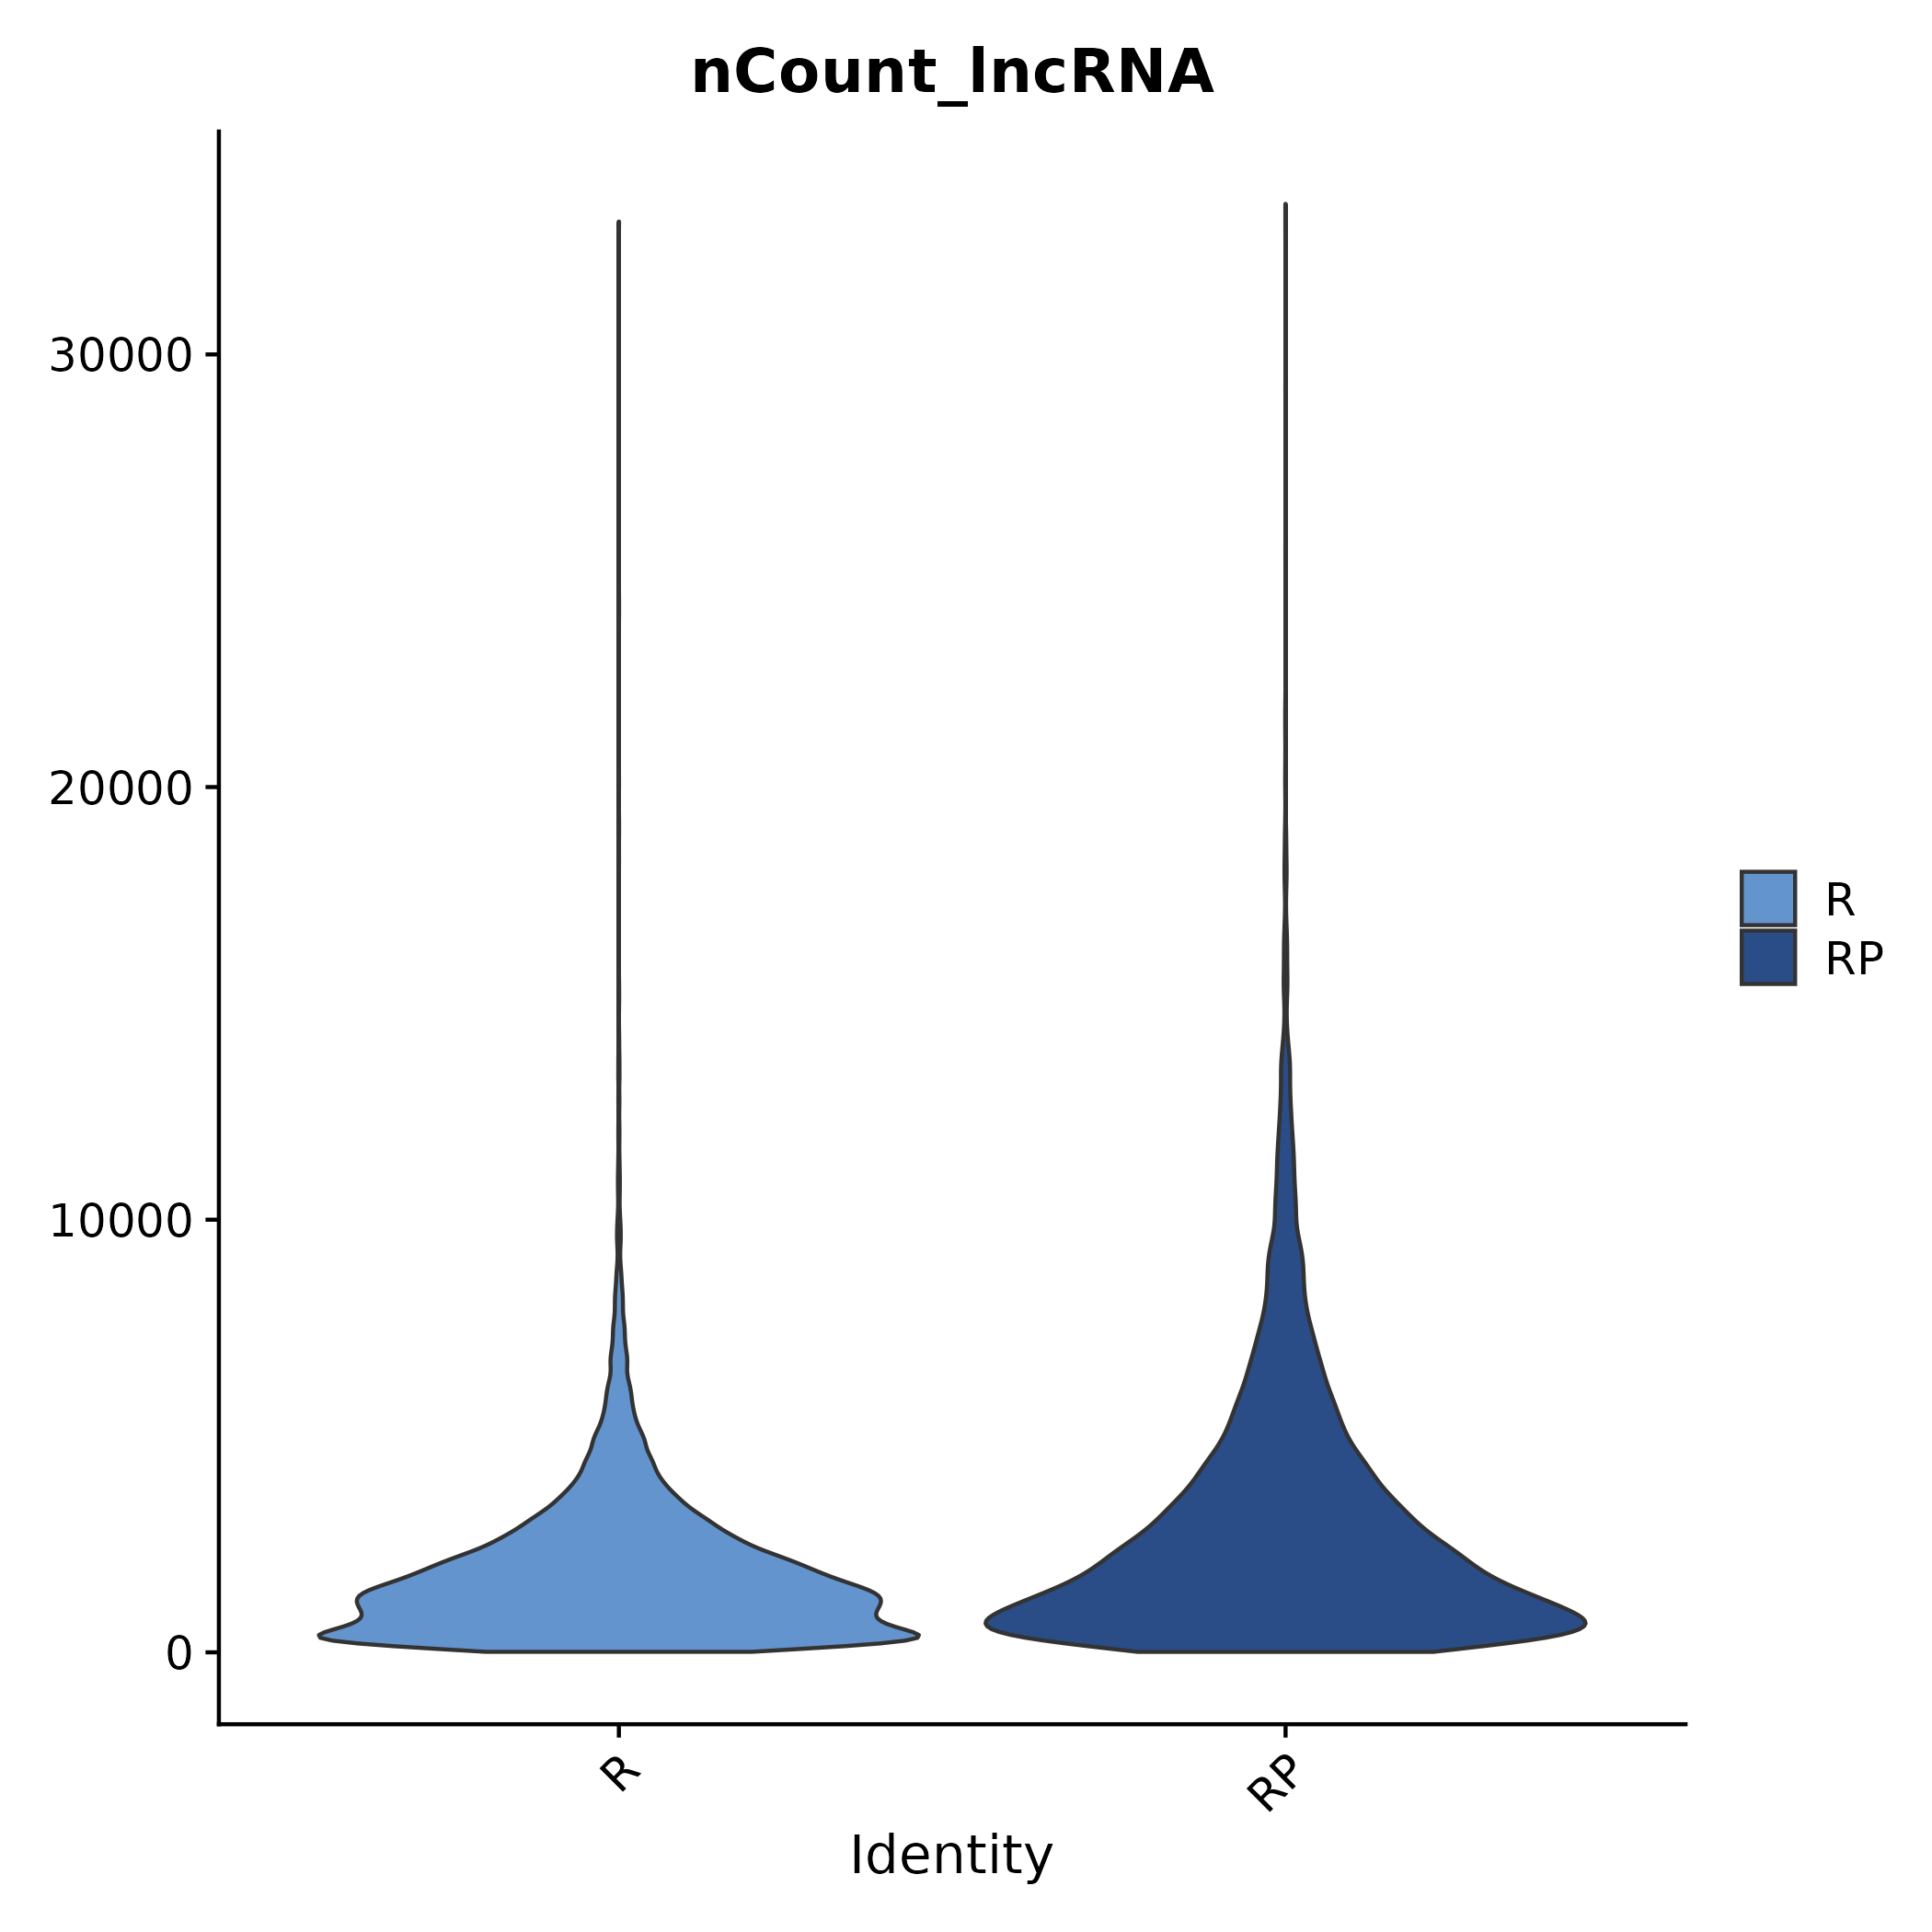
- Chart Interpretation: Shows distribution differences in lncRNA or protein-coding RNA UMI count (nCount) and gene count (nFeature) between comparison groups, which can be in the form of violin plots/box plots.
- Analysis Points: Used to assess whether sequencing depth and detected gene count are balanced between different groups; if differences are significant, caution is needed when interpreting differences and networks, or consider adding covariates/standardization strategies.
5.5.3 Differential Result Visualization
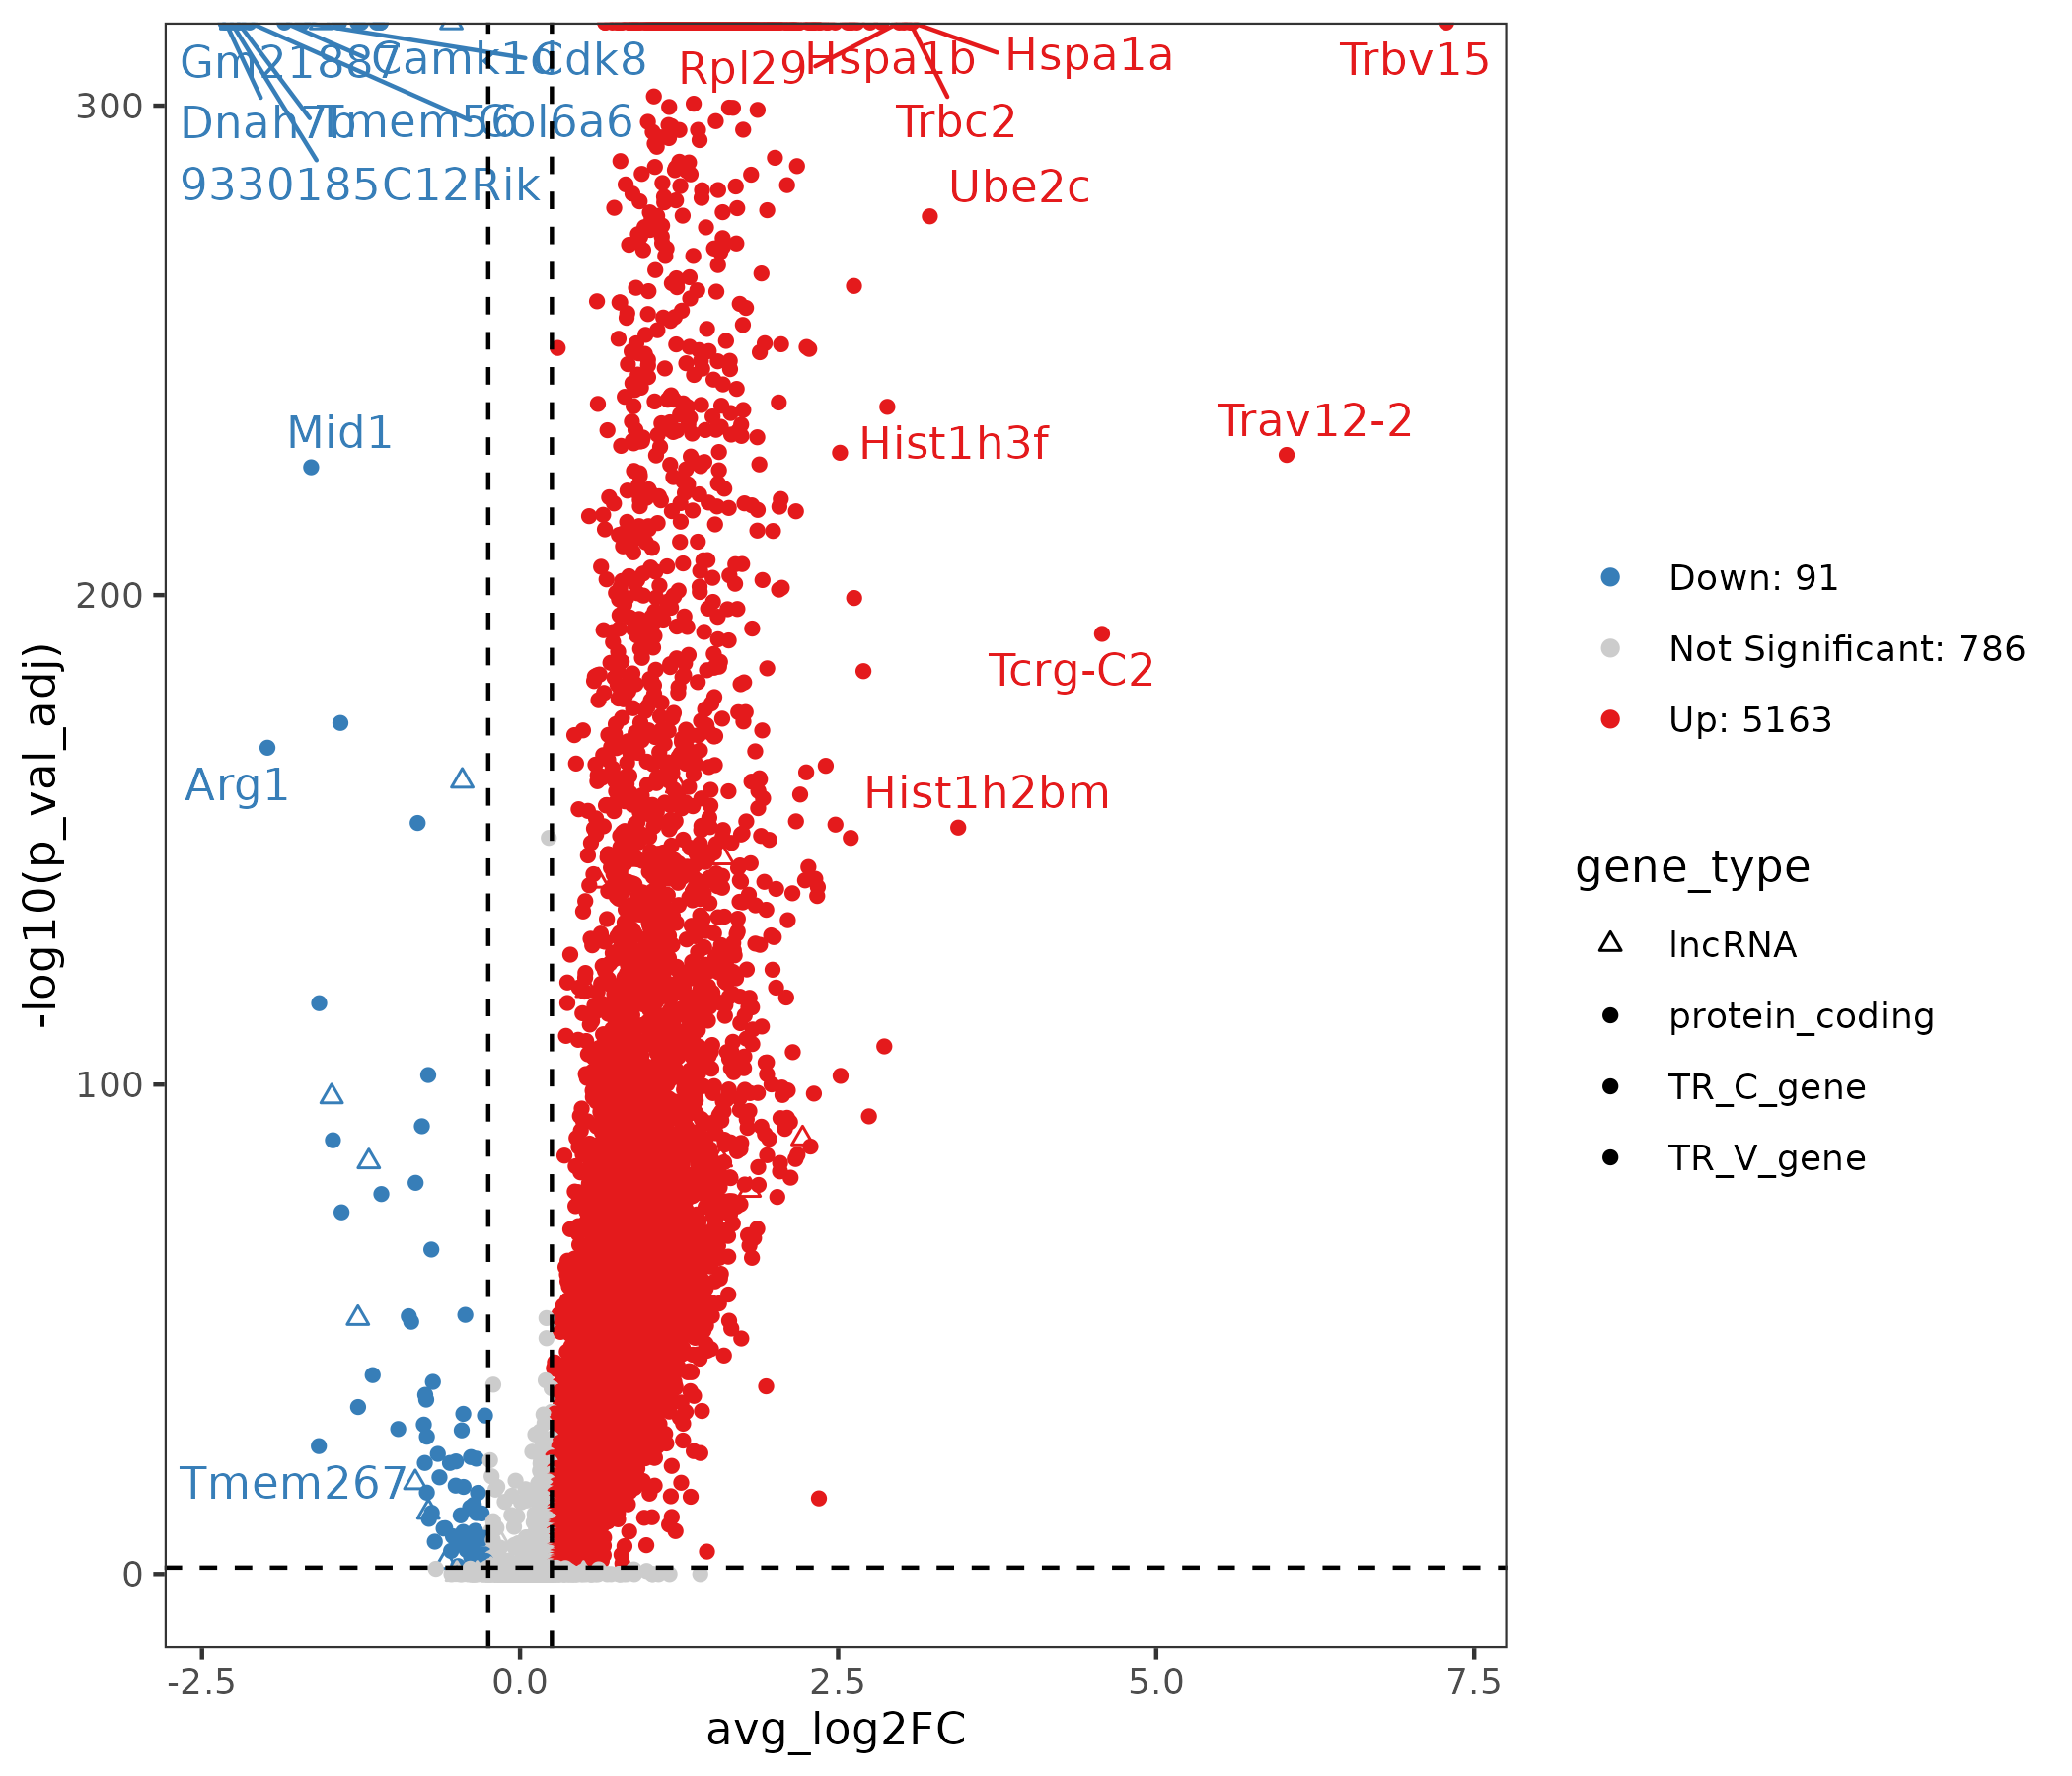
- Chart Interpretation: The x-axis shows effect size (log2FC), the y-axis shows significance (-log10 p.adjust); points represent genes, red indicates up-regulated genes, blue indicates down-regulated genes, gray indicates non-significant genes; the right side lists the number of up-regulated and down-regulated genes; shapes represent different gene types.
- Analysis Points: Focus on significant lncRNAs with large effect sizes and key protein-coding genes; combine with Tau and network results to screen robust candidates.
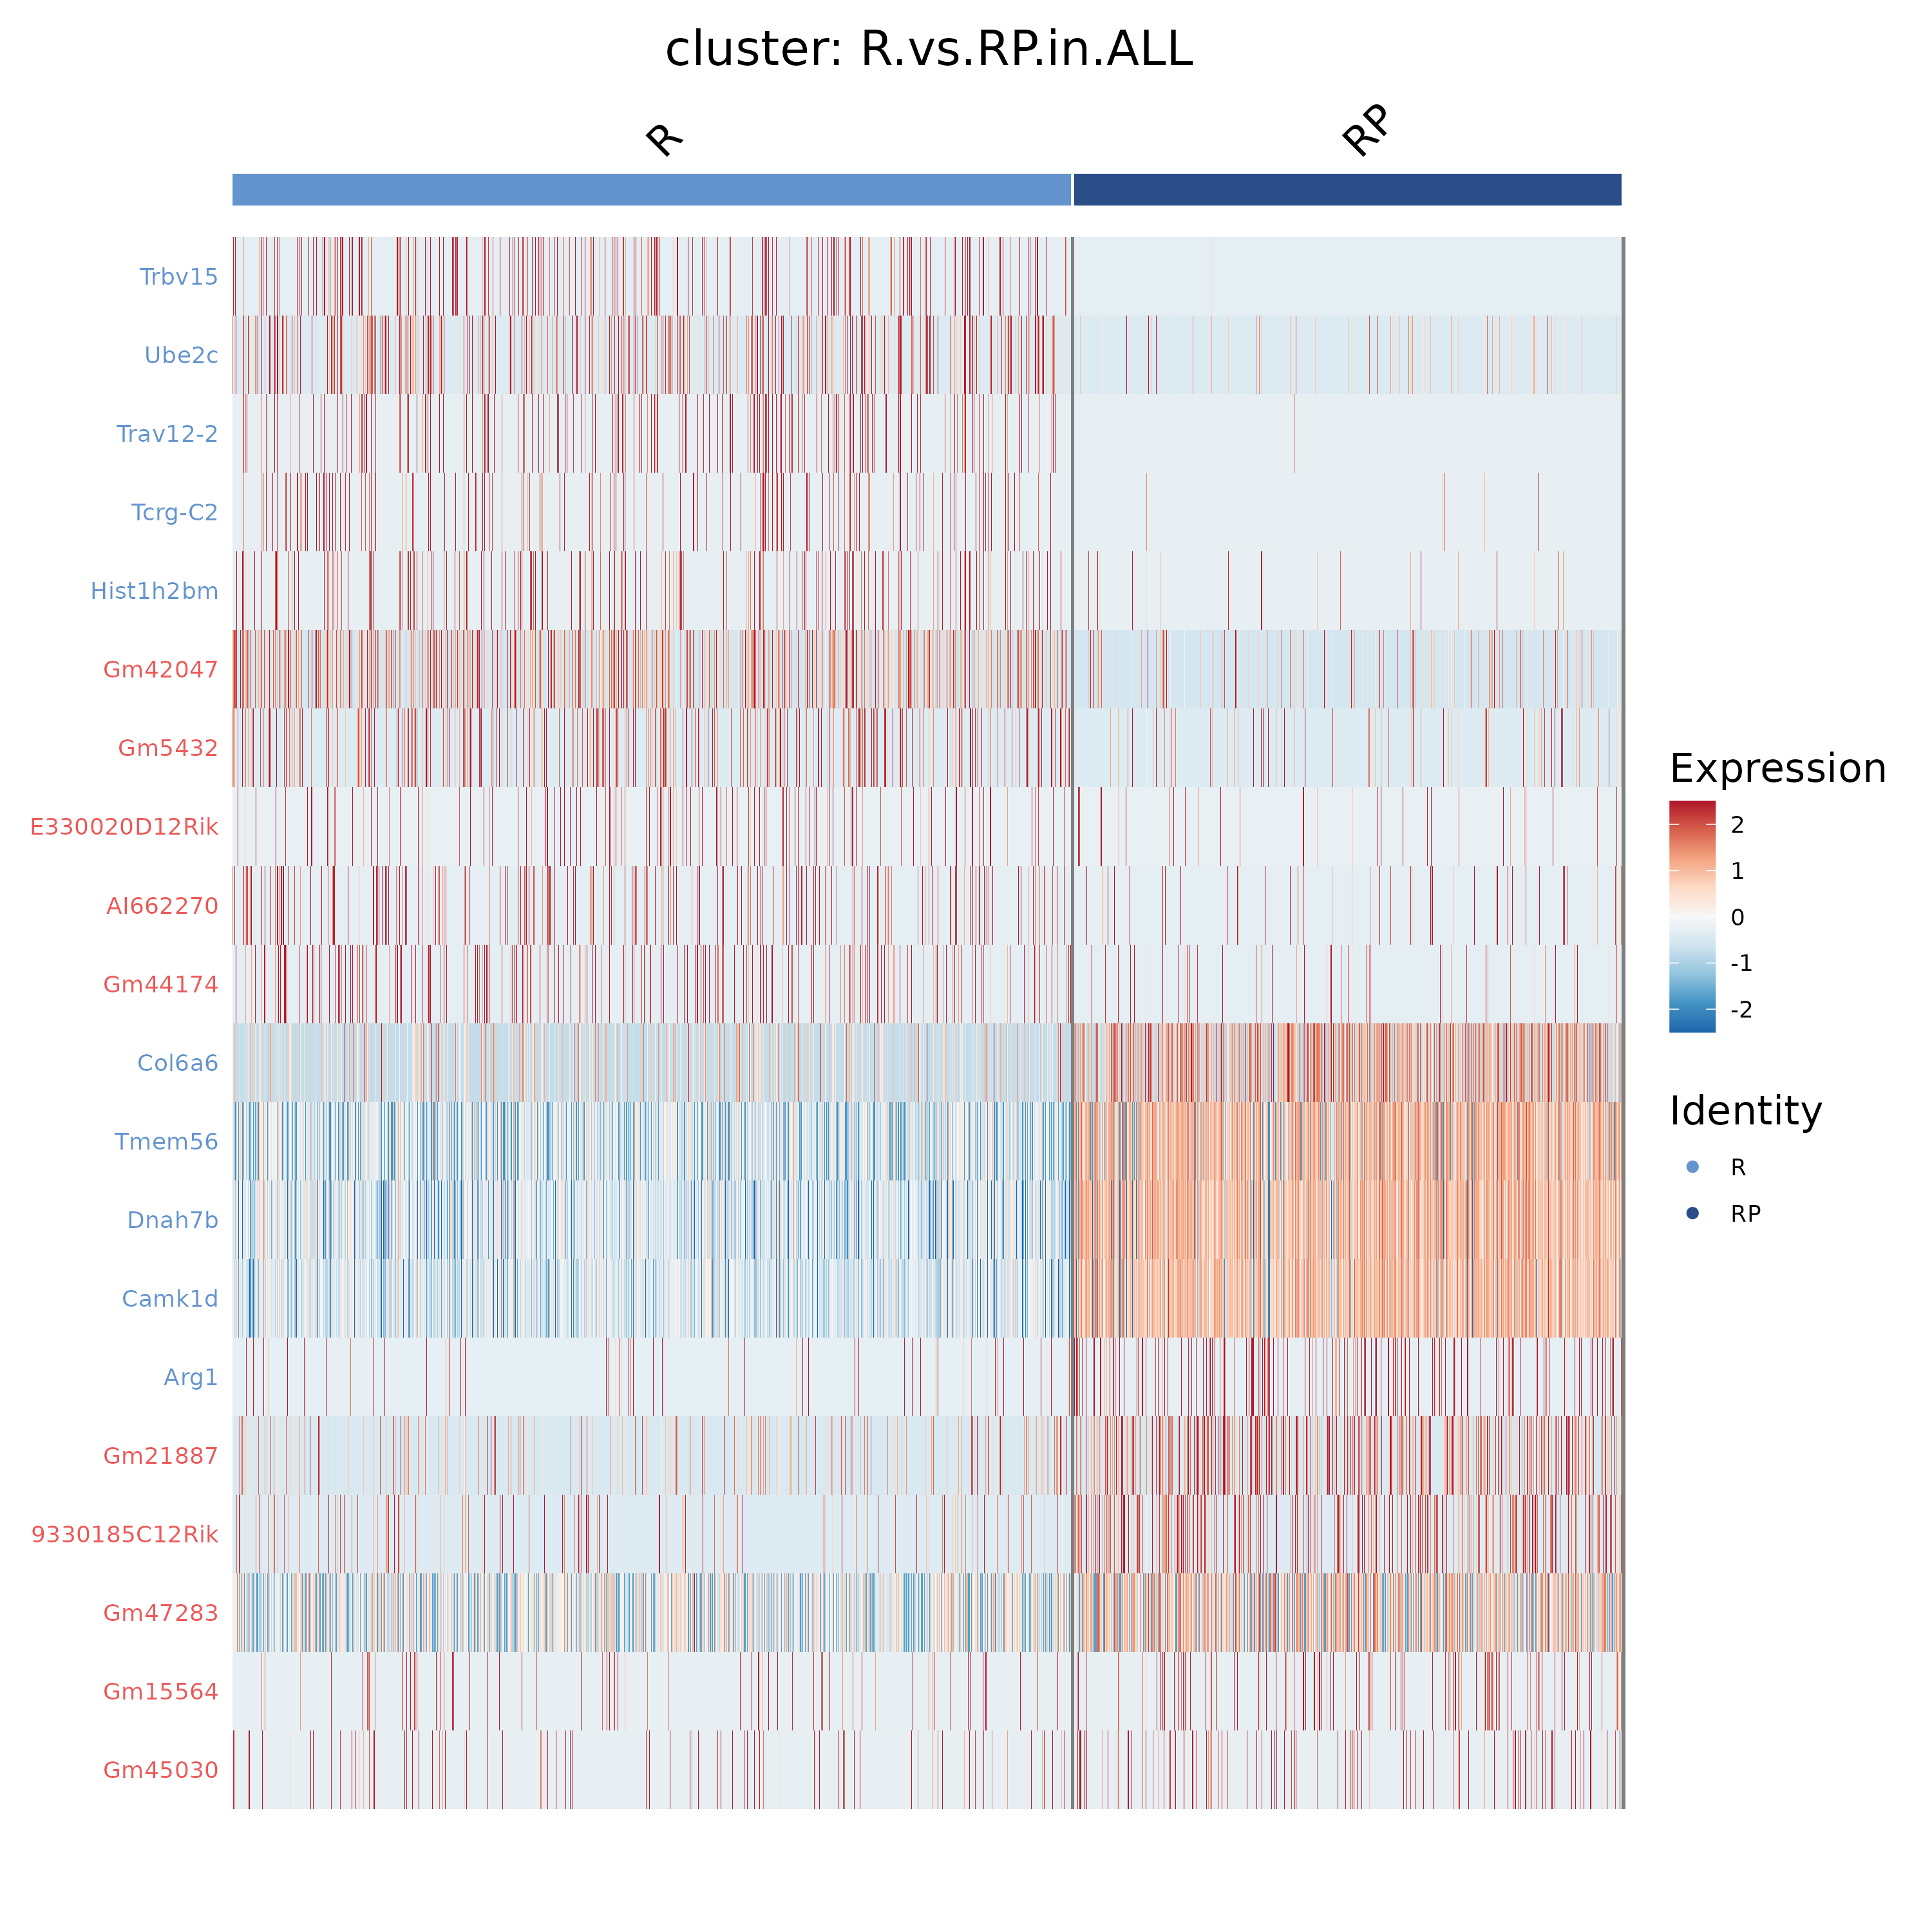
- Chart Interpretation: Rows represent differential genes, columns represent cells; colors indicate expression levels, with red representing higher gene expression and blue representing lower gene expression.
- Analysis Points: Check whether the overall expression patterns of differential genes in different groups are clearly separated; if subpopulation-specific patterns appear, it is recommended to combine with the network results in 5.5.4 to explain their functional associations.
5.5.4 Co-expression Networks and Modules of Comparison Groups
- Chart Interpretation: Nodes represent genes (squares for lncRNAs, circles for protein-coding genes), edges represent high-confidence co-expression relationships; node colors can represent up/down-regulation direction in comparison, with red for up-regulated genes (avg_log2FC > 0) and blue for down-regulated genes (avg_log2FC < 0).
- Analysis Points: Identify key lncRNA center nodes specific to or significantly changed in the treatment group and their neighborhoods, speculate on their potential regulatory roles and affected functional gene groups.
- Chart Interpretation: Different colors represent different communities (functional modules), where genes within communities show highly consistent expression patterns and may participate in the same biological process.
- Analysis Points: Compare the composition and scale of modules in different groups, identify newly appearing or significantly changed modules to pinpoint treatment-driven network restructuring signals.
5.5.5 Module Enrichment of Comparison Groups
- Chart Interpretation: Shows GO enrichment bar plots for significant modules in the comparison scenario, indicating potential biological functions of each module.
- Analysis Points: Locate GO terms that are only significant in the treatment group as direct evidence of treatment-induced functional changes; combine with network central genes and lncRNAs for biological interpretation.
- Chart Interpretation: Shows KEGG enrichment bar plots for significant modules in the comparison scenario.
- Analysis Points: Focus on key signaling pathways related to the research topic (such as immune/inflammatory/metabolic pathways), cross-validate with GO results to improve the robustness of conclusions.
TIP
Comparative analysis can help identify condition/treatment-driven changes in lncRNA-protein coding gene relationships, revealing potential mechanistic differences at the network level.
5.6 Result File List
| Directory/File | Description |
|---|---|
01_lncRNA_info/ | Charts and tables related to lncRNA expression overview (such as cluster_umap.png, lnc_fraction.png, nCount_lncRNA.png, top10_lncRNA_genes.png, Tau scores, and top 4 gene visualizations). |
02_cor_and_get_matrix/ | Gene correlation and matrix files calculated by cluster (such as correlation coefficient/importance matrices, node/edge tables, etc.), used for subsequent network construction and threshold screening. |
03_module_plots/<Cluster>/ | Network and module plots constructed by cell cluster (<Cluster>_network.png, cluster_<Cluster>_network_community.png), as well as enrichment result charts in GO/ and KEGG/ subdirectories. |
04_compare/<Pair>/ | Differential visualizations by comparison pair (e.g., R.vs.RP/): umap_split_by_Sample.png, nCount_lncRNA.png, *.volcano.png, *.heatmap.png, etc. |
05_compare_cor_and_get_matrix/ | Gene correlation and matrix files calculated by comparison scenario (comparison versions of node/edge/correlation results), used for constructing comparison group networks and modules. |
06_compare_module_plots/<Pair>/ | Network and module plots by comparison pair, as well as corresponding GO/, KEGG/ enrichment results. |
Notes
1. Novel-lnc step is time-consuming and data quality dependent: If only conducting known lncRNA co-expression analysis, it is recommended to first disable this option to speed up the process.
2. Metadata naming conventions: It is recommended to use all English, avoid Chinese and special characters; naming of different samples/batches should be unified.
3. Comparison strategy recommendations: Perform both "ALL" level and "within-cluster" level comparisons simultaneously to capture general and fine-grained differences.
Frequently Asked Questions (FAQ)
Q1: What prerequisites are needed to enable "Identify novel-lnc"?
A: bam_path for each sample is required; this step is time-consuming and sensitive to alignment quality and reference annotation completeness.
Q2: Why do some clusters not yield modules or enrichment results?
A: Common reasons include too few differential genes or overly sparse networks being filtered out (e.g., degree < 7).
Q3: What to do if the network is too complex to interpret?
A: Prioritize focusing on lncRNAs with high centrality and their adjacent modules for hierarchical interpretation.
Q4: How to understand the Tau specificity score?
A: Tau closer to 1 indicates high specificity in fewer clusters; closer to 0 indicates widespread expression across multiple clusters. It can be comprehensively assessed in combination with differential analysis and network position.
Q5: Can results be used for cross-species comparison between animals/humans?
A: This module supports human/mouse; cross-species comparison requires additional gene homology mapping steps, which are not built into this module.
References
[1] SANTUS L, SOPENA-RIOS M, GARCÍA-PÉREZ R, et al. Single-cell profiling of lncRNA expression during Ebola virus infection in rhesus macaques[J]. Nat Commun, 2023, 14: 3866.
[2] VAN DE SANDE B, FLERIN C, DAVIE K, et al. A scalable SCENIC workflow for single-cell gene regulatory network analysis[J]. Nature Protocols, 2020, 15: 2247–2276.
[3] HAO Y, HAO S, ANDERSEN-NISSEN E, et al. Integrated analysis of multimodal single-cell data[J]. Cell, 2021, 184: 3573–3587.
[4] KIM D, PAGGI J M, PARK C, et al. Graph-based genome alignment and genotyping with HISAT2[J]. Nat Methods, 2019, 16: 887–938.
[5] DOBIN A, DAVIS C A, SCHLESINGER F, et al. STAR: ultrafast universal RNA-seq aligner[J]. Bioinformatics, 2013, 29: 15–21.